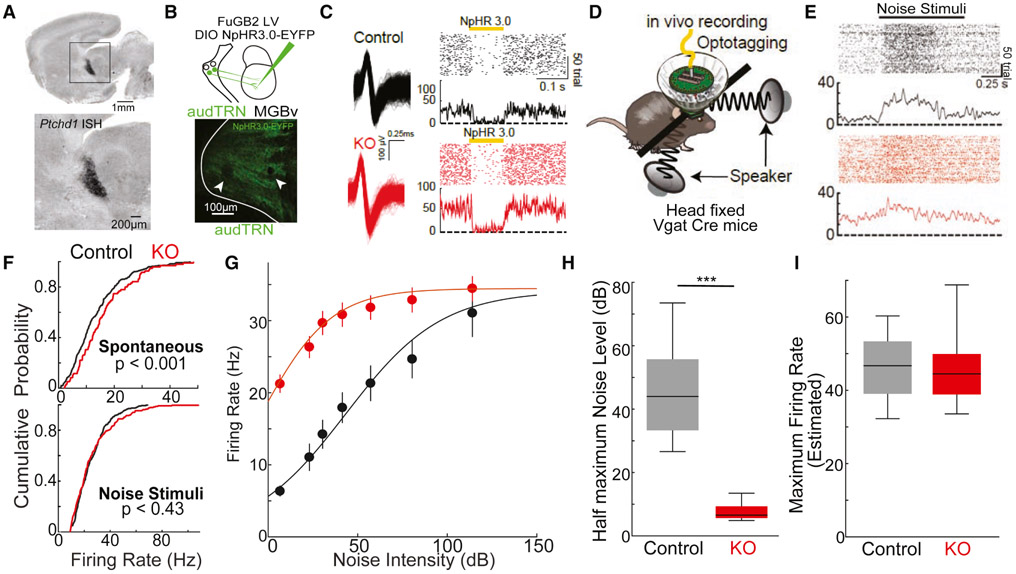
Figure 1: Sound evoked responses of audTRN neurons are diminished in the KO.
A. In situ hybridization showing expression of PtchD1 in TRN during early development (P0)
B. (Top) Strategy to label audTRN neurons. MGBv projecting audTRN neurons were selectively labeled by injecting the MGBv of Vgat Cre mice with retrograde lentivirus (FuGB2LV) harboring Cre-dependent NpHR3.0-EYFP. (Bottom) Example confocal image showing electrode tips lesions and NpHR3.0-EYFP expression in the audTRN.
C. (Left) Example audTRN waveforms in control (top, black) and KO (bottom, red) mice. (Right) Peri-stimulus time histogram (PSTH)s and rasters showing short latency optogenetic suppression (100ms, yellow bar) of audTRN neurons via NpHR3.0 in control (black) or KO (red) mice.
D. Schematic of head-fixed recording with multi-electrode drive targeting audTRN to record their sound responses. Sound was presented binaurally by two speakers.
E. Example PSTHs and rasters showing diminished sound responses (1s, black bar) of audTRN neurons in KO (bottom) compared to control (top).
F. Cumulative probability plot of audTRN firing rates before (spontaneous, top) or during the sound presentation (noise stimuli, bottom) recorded across control (black, N = 3 mice, 602 neurons) and KO (red, N = 3 mice, 468 neurons) animals (Kolmogorov-Smirnov test).
G. Average firing rate of control (black) and KO (red) audTRN neurons in response to increasing intensity noise stimuli. KO audTRN neurons showed high firing at lower noise level but smaller increase across intensities. (N = 3 control, M = 3 KO mice; n = 88 control, m = 447 KO neurons; error bars show s.e.m.)
H. Estimated noise level required to reach the inflexion point (corresponding to the half maximum of the sigmoidal fit) based on control and KO neuron responses in G. Half-maximal values were significantly lower in KO compared with controls (p < 0.001 rank-sum).
I. Estimated maximum firing rates of control and KO neurons. Estimates did not significantly differ between groups. (p = 0.06, rank-sum).
Boxplots: median (line), quartiles (box), 95% confidence interval (whiskers)
See also Figure S1

