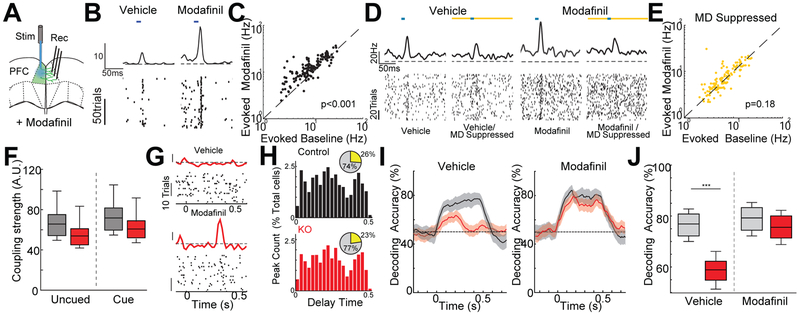
Figure 5: Modafinil restore cue encoding in the KO PFC.
A. Cartoon illustrating the approach used to measure intra-PFC connectivity via optical stimulation.
B. The evoked response of a PFC neuron to intra-PFC stimulation (blue bar) is much stronger with Modafinil injection
C. Modafinil significantly increased strength of evoked peak responses, demonstrating that modafinil can increase intra-PFC connectivity. (N= 2 mice, n=155 neurons, sign-rank test)
D. Example rasters and PSTHs from a PFC neuron showing that the effect of modafinil on stimulated intra-PFC connections (Blue bar) disappeared when MD was silenced (Yellow bar).
E. Modafinil effects on intra-PFC connectivity disappeared with MD suppression (N = 2 mice, n=155 neurons, sign-rank test)
F. Quantification of the positive coupling strengths in the PFC of control (grey) and KO (red) mice during the delay period with or without modafinil. Modafinil restored connectivity to control levels in the KO (p < 1.3x10⁻²³, MANOVA; N = 4 control, 4 KO mice, n = 863 control, 947 KO neurons recorded; rank-sum test).
G. Example rasters and PSTHs of a KO PFC neuron during delay of the cued noisy auditory discrimination task following injection of vehicle (top) or modafinil (bottom). Following modafinil administration a new task related response peak was observed (scale bar: z-score = 1).
H. Distribution of peak times for control (top, black) or KO (bottom, red) mice following modafinil injection as a percentage of total neurons. Peak numbers and temporal distribution were comparable between control and KO following modafinil administration (totals for each genotype shown as inset pie-charts, yellow – peak cells; p < 0.01, KO modafinil vs vehicle non-significant for KO vs control with modafinil binomial test, N = 4 control, 4 KO mice, n = 863 control, 947 KO neurons).
I. Poisson Naïve bayes decoding of predictive cue against unpredictive cue in control (grey) or KO (red) mice showing that modafinil (right) significantly increased cue encoding in the KO compared with vehicle (left). Shaded region indicates 95% confidence intervals.
J. Quantification of the comparisons of decoding with and without modafinil shown in I (p < 8.5x10−89 MANOVA, N = 4 control, 4 KO mice, n = 863 control, 947 KO neurons recorded, *** p < 0.001, binomial test).
Boxplots: median (line), quartiles (box), 95% confidence interval (whiskers)
See also Figure S5

