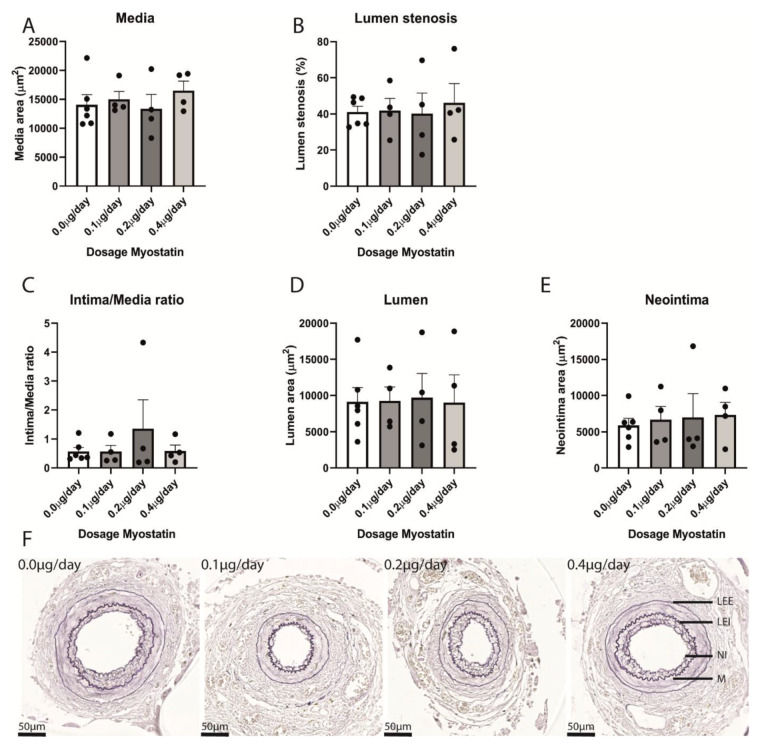
Figure 4.
(A–F): Quantification of restenosis in cuffed femoral arteries in different treatment groups. (A)—Media area was similar in different treatment groups. (B)—Lumen stenosis did not differ between treatment groups. (C)—Intima/Media ratio was similar in different treatment groups. (D)—Lumen area in different treatment groups was equal. (E)—Neointima area in different treatment groups did not differ. (B–E): Quantification of not occluded arteries. Mean expression is shown and error bar represents SEM. n = 7 in control group, n = 4 in 0.1 µg/day, n = 4 in 0.2 µg/day, n = 4 in 0.4 µg/day. Student’s t-test, performed between myostatin treated groups and control group with α = 0.05, did not show any significant differences. (F)—representative examples of cuffed femoral arteries in different treatment groups. LEE = Lamina Elastica Externa, LEI = Lamina Elastica Interna, NI = Neointima, M = Media.

