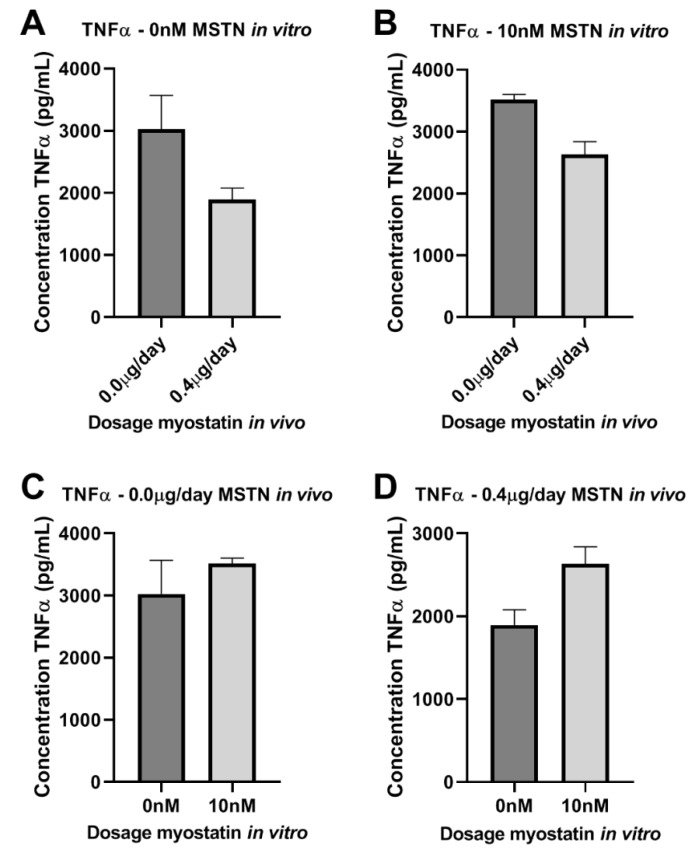
Figure 7.
(A–D): Effect of myostatin on macrophages. (A–D)—TNFα in supernatant of bone marrow macrophages stimulated with myostatin. (A,B)—in vivo treated mice with 0.0 vs. 0.4µg myostatin/day and not treated in vitro with myostatin (A) or in vitro treated with 10 nM myostatin (B) did not show significant differences. (C,D)—in vivo not treated (C) or treated (D) and in vitro not treated or treated with myostatin did not show significant differences. Mean expression is shown as average of duplicate measurements of pooled cells and error bar represents SEM. Student’s t-test did not show significant differences.

