Figure 8.
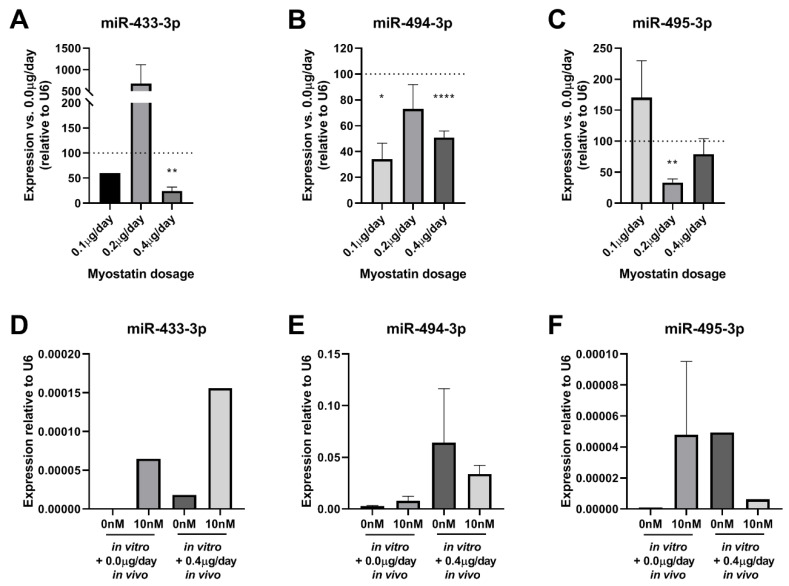
(A–F): microRNA expression in femoral arteries and macrophages. (A)—miR-433-3p expression in femoral arteries of 0.1, 0.2, 0.4 µg/day of myostatin relative to control mice (100%) showed significant downregulation of miR-433-3p at 0.4 µg/day (p = 0.003). (B)—miR-494-3p expression in femoral arteries of 0.1, 0.2, 0.4 µg/day of myostatin relative to control mice (100%) showed significant downregulation of miR-494-3p at 0.1 (p = 0.001) and 0.4 µg/day (p < 0.0001). (C)—miR-495-3p expression in femoral arteries of 0.1, 0.2, 0.4 µg/day of myostatin relative to control mice (100%) showed significant downregulation of miR-495-3p at 0.2µg/day (p = 0.0003). For (A–C) Mean expression is shown and error bars represent SEM (n = 8 for 0.0, 0.1 and 0.4 treatment groups, n = 6 for 0.2 treatment group). One-sample t-test performed with 100% expression of control group. * p < 0.05, ** p < 0.01, **** p < 0.0001. (D)—miR-433-3p expression did not show any differences between groups. (E)—miR-494-3p expression did not show any differences between groups. (F)—miR-495-3p expression did not show any differences. For (D–E) bone marrow monocytes matured into macrophages from in vivo treated mice with 0.0 vs. 0.4 µg myostatin/day and in vitro treated without myostatin or with 10 nM myostatin. Maturated cells were stimulated with LPS to trigger an inflammatory reaction. Mean expression is shown as average of duplicate measurements of pooled macrophages and error bar represents SEM. Wilcoxon rank sum test did not show any differences.

