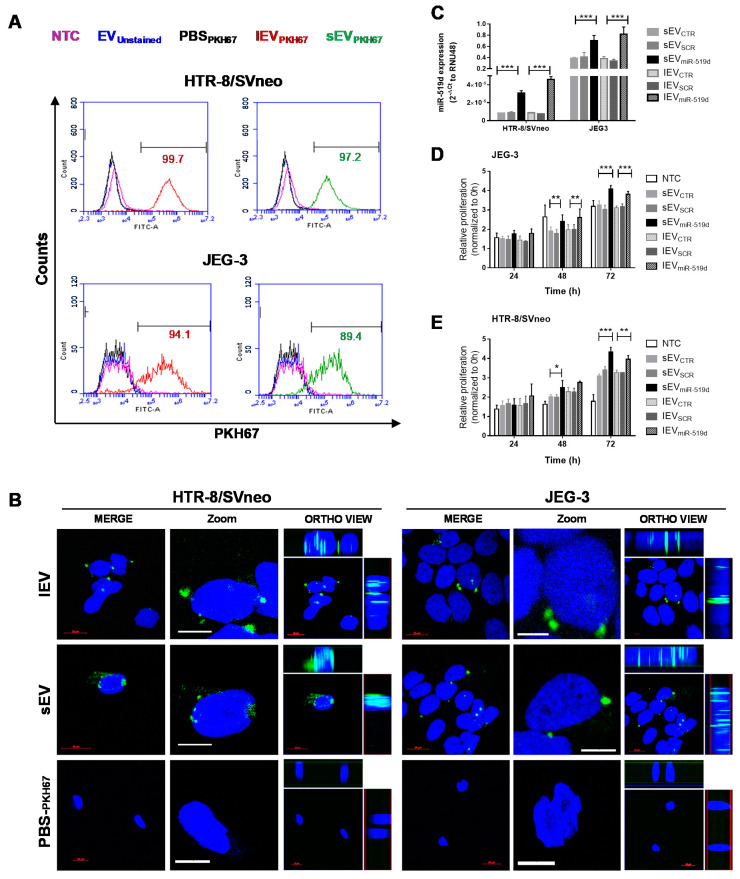
Figure 5.
Uptake of trophoblastic EVs by autologous cells. (A) Flow cytometry analysis of HTR-8/SVneo and JEG-3 cells co-incubated with unstained (EVunstained) or PKH-67-labeled EVs (sEVPKH67 and lEVPKH67) or treated with EV-free PBSPKH67. Non-treated cells (NTC). Numbers (green/red) indicate the respective percentages of labeled cells. (B) Cellular uptake of autologous EVs (lEVPKH67 and sEVPKH67) in HTR-8/SVneo and JEG-3 cells imaged by confocal laser scanning microscopy. The fluorescence of DAPI and that of PKH-67 are labeled with blue and green, respectively. Merged are shown for HTR-8/SVneo and JEG-3 cells and displayed in two different magnifications. Ortho-view images of the z-stack show EVs inside the cells. Scale bars: 10 μm. (C) miR-519d-3p expression in recipient cells by qPCR normalized to RNU48. (D) Cell proliferation of HTR8/SVneo and (E) JEG-3 cells relative to NTC at 0 h. C–E: HTR-8/SVneo and JEG-3 cells were treated with sEVs and lEVs isolated from cells transfected with miR-519d-3p mimic (sEVmiR-519d and lEVmiR-519d), SCR mimic (sEVSCR and lEVSCR) or non-transfected controls (sEVCTR and lEVCTR). Bars represent means ± SDs, n = 3. Two-way ANOVA with Bonferroni multiple comparison test. * p < 0.05, ** p < 0.01, *** p < 0.001.

