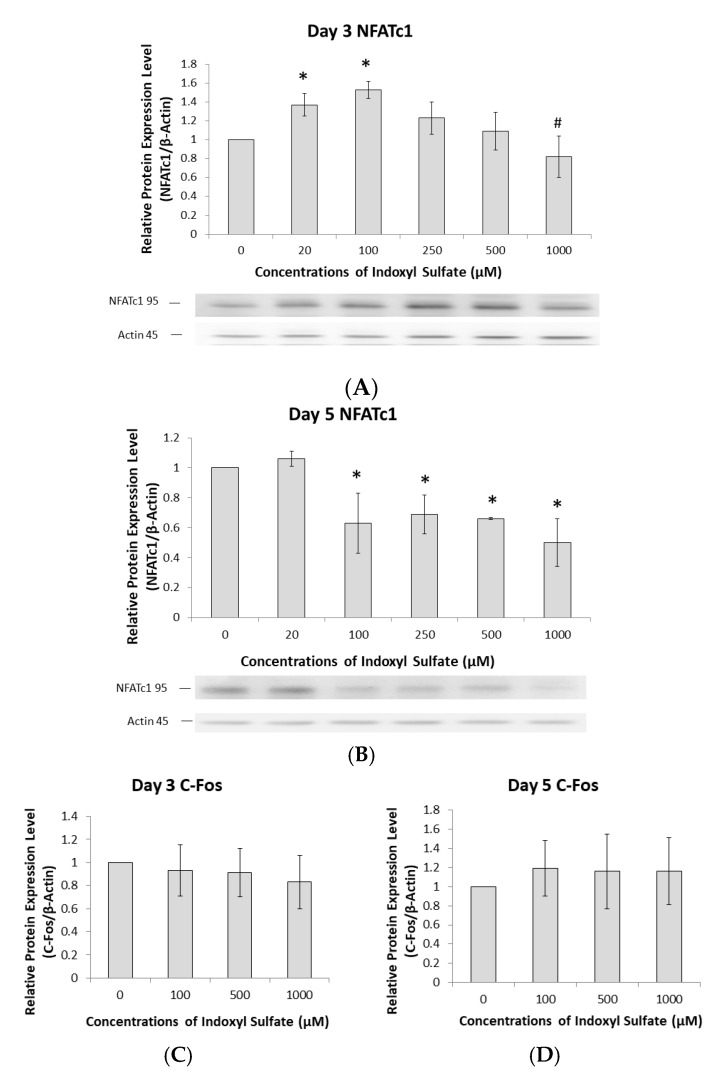
Figure 3.
The AhR pathway mediates IS regulation of NFATc1 but not c-Fos. Raw 264.7 cells with 50 ng/mL of sRANKL were cultured in IS at 0, 100, 500, and 1000 µM for 3 and 5 days. (A) NFATc1 expression in osteoclast precursors on Day 3 depends on the IS concentration. Western blot analysis showed that <100 µM IS increased NFATc1 expression, but >250 µM inhibited it in a dose-dependent manner. Error bars represent mean ± SD (n = 3). * p < 0.05 compared to the control group. # p < 0.05 compared to 100 µM IS. (B) NFATc1 expression in mature osteoclasts on Day 5 depends on the IS concentration. Western blot analysis showed that 20 µM IS increased NFATc1 expression, but >100 µM decreased it. Error bars represent mean ± SD (n = 3). * p < 0.05 compared to the control group. (C,D) c-Fos expression in osteoclasts at different IS concentrations on Day 3 and 5. Western blot analysis showed no significant relationship between c-Fos expression and IS concentrations. Error bars represent mean ± SD (n = 4).

