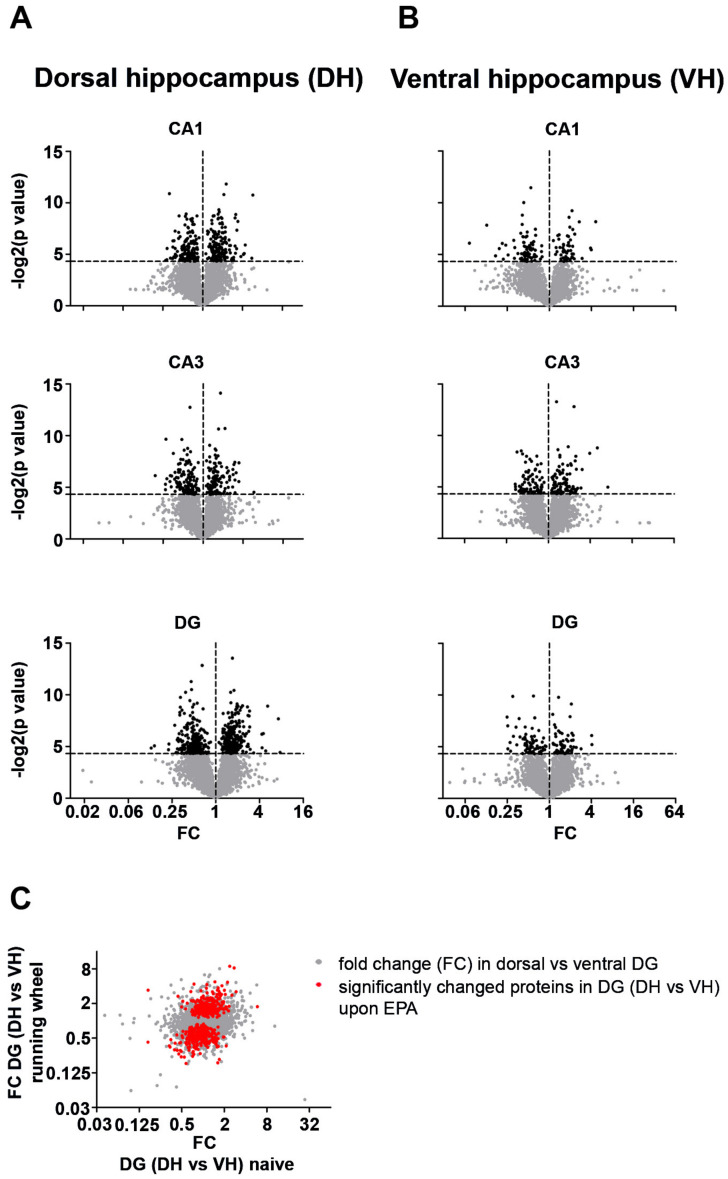
Figure 4.
Dorsal and ventral hippocampal subregions show different proteomic adaptations in response to enhanced neurogenesis. (A,B) Volcano plots showing the fold change (FC) and p-value for dorsal (A) and ventral (B) hippocampal subregions. (C) FC for proteins in the dorsal versus ventral DG prior and upon running wheel exposure. Red dots indicate significantly affected proteins upon enhanced physical activity (EPA). Voluntary exercise increases the expression of metabolic enzymes in the hippocampus.

