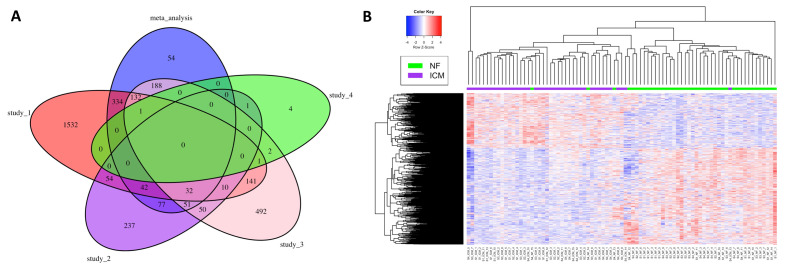
Figure 1.
Venn diagram and heatmap summarizing meta-analysis identified DEGs. (A) Venn diagram summarizing common DEGs among the meta-analysis and the individual studies. (B) Heatmap of the DEGs identified by the meta-analysis. S1, S2, S3, S4: Study_1, Study_2, Study_3, Study_4 (Table 1).

