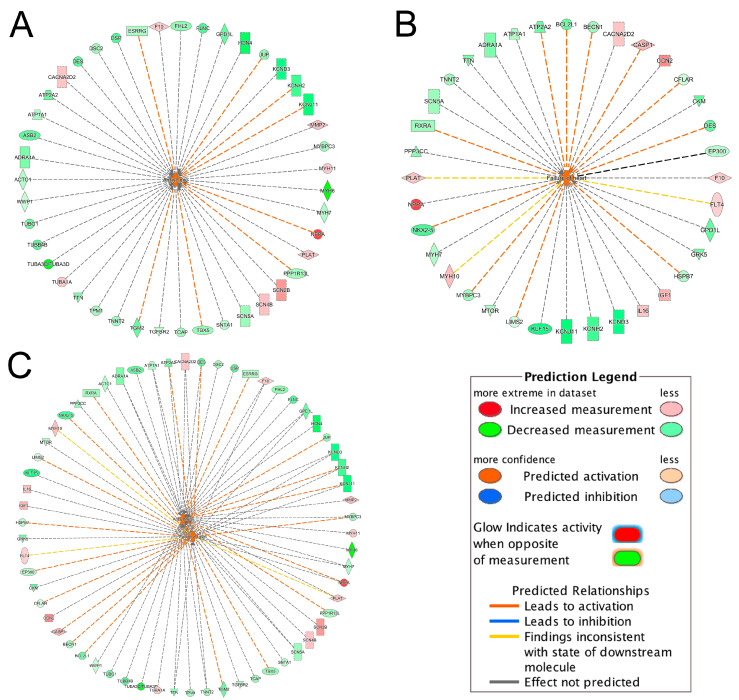
Figure 2.
Interactions of significantly activated toxicity pathways with their associated DEGs. (A) arrhythmia; (B) failure of heart; (C) integrated toxicity pathways. For example, in Figure 2A, the gene TBX5 was downregulated as indicated by the green color and the downregulation of TBX5 further promoted (indicated by the orange dash line) the activation of arrhythmia, as indicated by the orange color. For other indicators, please refer to the Prediction Legend.

