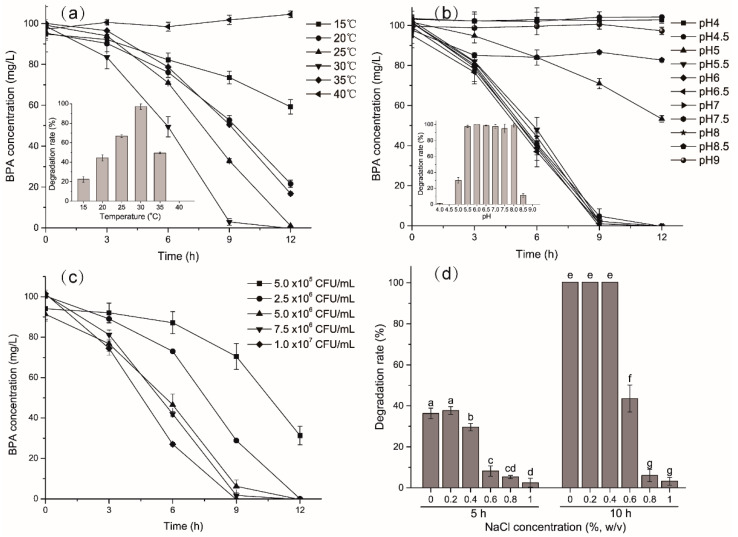
Figure 2.
Effect of (a) temperature; (b) pH; (c) inoculums density and (d) NaCl concentration on biodegradation of BPA. The error bar value presents the standard deviation of triplicates. Inset shows BPA biodegradation efficiency at 9 h on different (a) temperature and (b) pH value. Different letters indicate statistically significant differences at p ≤ 0.05; similarly hereinafter.

