. 2020 Jun 8;43(3):e20190153. doi: 10.1590/1678-4685-GMB-2019-0153

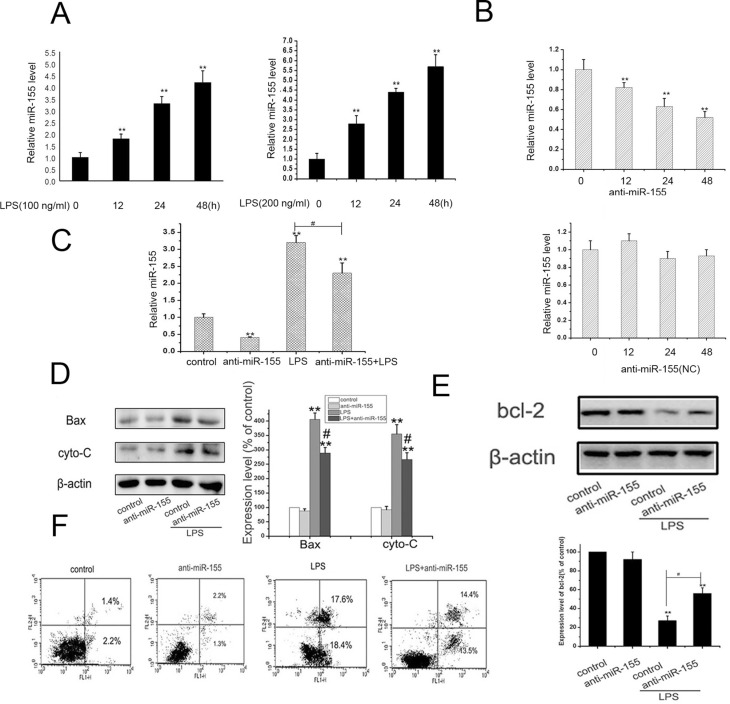
Figure 3. Knock-down of miR-155 inhibited LPS-induced cell apoptosis. (A) MC3T3-E1 cells were cultured with 100,200 ng/ml LPS for 0, 12, 24 and 48 h, and the level of miR-155 was detected by qRT-PCR, U6 was as the loading control. The data were mean ± SEM (n=5). (** P<0.01, vs. 0 h group). (B): miR-155 inhibitor and inhibitor control (NC) were transfected using Lipofectamine 3000 and cultured for 0, 12, 24 and 48 h and the level of miR-155 was detected by qRT-PCR, U6 was as the loading control. The data were mean ± SEM (n=6). (** P<0.01, vs. 0 h group). (C): MC3T3-E1 cells were transfected with miR-155 inhibitors and cultured for 24 h. Then, the control cells and anti-miR-155 cells (after transfection for 48 h) were cultured with or without 200 ng/ml LPS treatment for 24 h and the level of miR-155 mRNA was detected by qRT-PCR. U6 was as the loading control. The data were mean ± SEM (n=6). (** P <0.01, vs. control group; # p<0.01 LPS group vs. LPS+anti-miR-155 group). (D,E) Cells were treated as aboved, western blots were performed with the antibodies indicated. Relative expression of Bax, cytochrome c and bcl-2 were calculated and normalized to the loading control β-actin. The data were mean ± SEM (n = 6). (** P < 0.01, vs. control, # P < 0.05, LPS vs. LPS+anti-miR-155 group). (F) Induction of apoptosis in LPS-induced cells was detected with annexin V-FITC/PI double staining. Results are representative of three experiments.

Figure 3