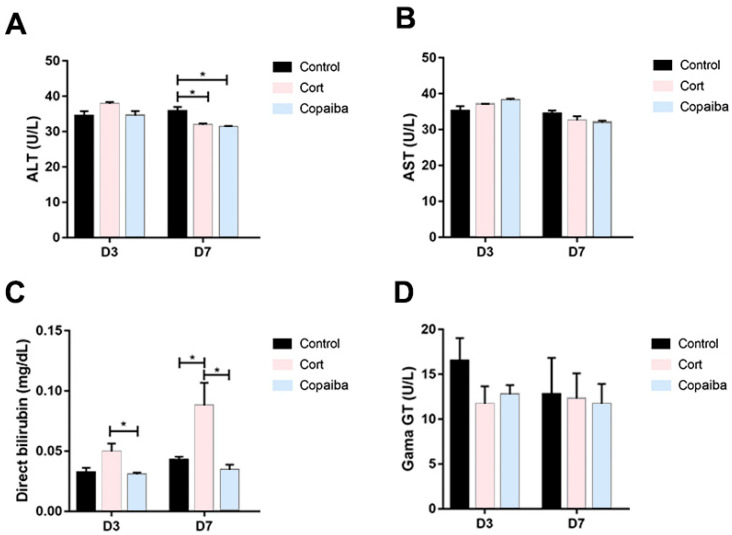
Figure 6.
Comparative biochemical parameters levels of liver function in different groups: (A) ALT, (B) AST, (C) DB and (D) GGT (* p < 0.05). Although DB was elevated in the corticoid-treated group on D3 (n = 15) and D7 (n = 15) (Figure 6C), GGT levels presented normal levels in all the groups. The results are expressed as the mean ± standard error of the mean. One-way ANOVA and Tukey’s post hoc tests (* p < 0.05).

