Figure 4.
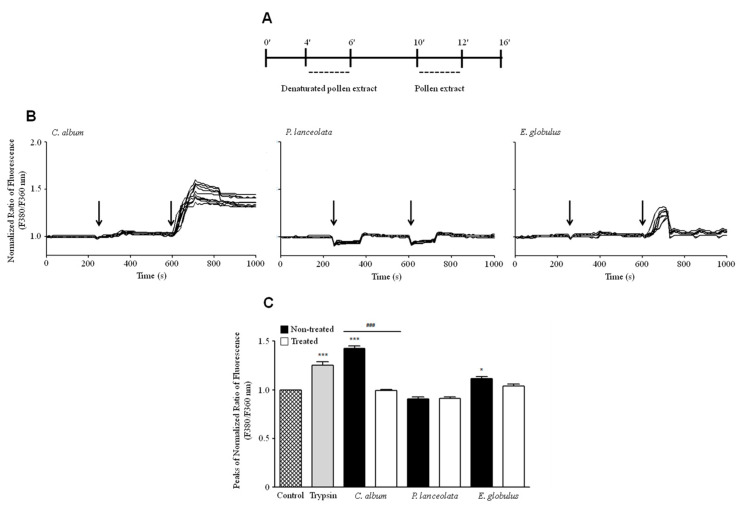
Functional characterization of the effect of pollen proteases from Chenopodium album (0.26 ± 0.06 mg/ml), Plantago lanceolata (0.18 ± 0.03 mg/ml) and Eucalyptus globulus (0.75 ± 0.18 mg/ml) on Calu-3 cells. (A) Calu-3 cultures were incubated for 240 s with Krebs solution and stimulated for 120 s with denatured pollen diffusates followed by 120 s incubation with pollen diffusates. (B) [Ca2+]i variations in Calu-3 cells after exposure to C. album (left graph), P. lanceolata (middle graph) and E. globulus (right graph). Arrows in each panel indicate the time of addition of the pollen diffusate. The fluorescence profiles are representative of 10 cells. (C) The bar graph shows the maximal changes in [Ca2+]i after stimulation with each pollen diffusate. Changes in [Ca2+]i are depicted by the F340/F380 fluorescence ratios of Fura-2-loaded Calu-3 cells. The black bars correspond to each pollen diffusate, while the white bars correspond to denatured pollen diffusates (95 °C for 30 min). The positive control for this assay was a 0.25% trypsin solution. The data are expressed as the mean ±SEM values of at least 30 representative cell traces using Bonferroni’s post-test: *** p < 0.001; * p < 0.05 (n = 4) in comparison to the control condition and for comparisons between treated and untreated conditions ### p < 0.001 (n = 4).

