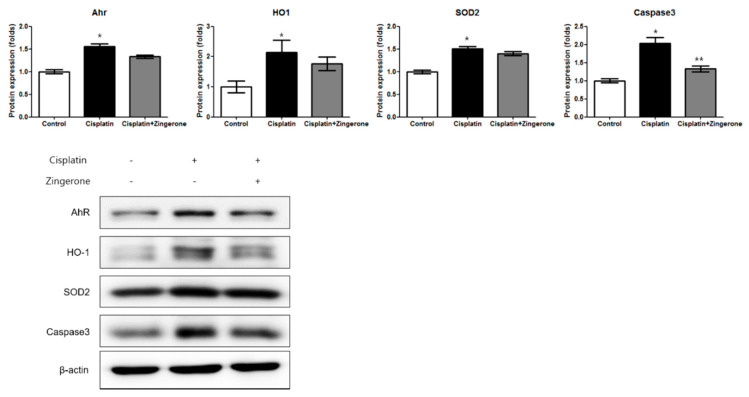
Figure 3.
The protein expression levels of the aryl hydrocarbon receptor (AhR), heme oxygenase 1 (HO1), superoxide dismutase 2 (SOD2), and caspase 3 were higher in the cisplatin group than in the control group (* p < 0.05, ANOVA with Tukey’s post hoc test, control vs. cisplatin groups; ** p < 0.05, ANOVA with Tukey’s post hoc test, cisplatin vs. cisplatin + zingerone groups). The protein expression levels of caspase 3 were lower in the cisplatin + zingerone group than in the cisplatin group (p = 0.03, ANOVA with Tukey’s posthoc test). The values shown in the graphs are the means ± standard deviations. (+: not administered, -: administered).

