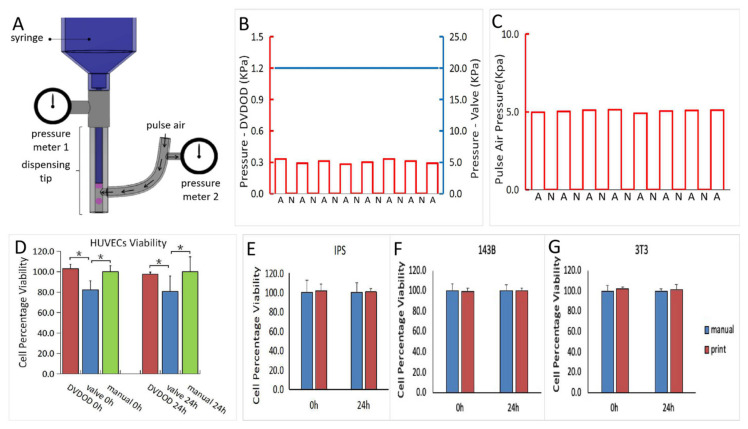
Figure 3.
(A) Illustration of the pressure measurement set-up in the DVDOD. (B) The plots of pressure measured from the syringes of the DVDOD (red, A: syringe-moving is activated, N: syringe-moving is not activated) and valve-based printing technology (blue). (C) The plot of the pressure measured from the pulsed air in the DVDOD. (D) Cell percentage viability of HUVECs in the DVDOD, valve-based technology, and the manual operation at 0 h and 24 h. All the values were normalized to those of manual operation. * represents significant difference (p < 0.05). (E–G) The cell percentage viabilities of Induced Pluripotent Stem (IPS), 143B, and MC3T3-E1 cells at 0 h and 24 h after bioprinting using DVDOD. All the values were normalized to those of manual operation. There was no significant difference observed in any cell type between the DVDOD and manual operation.

