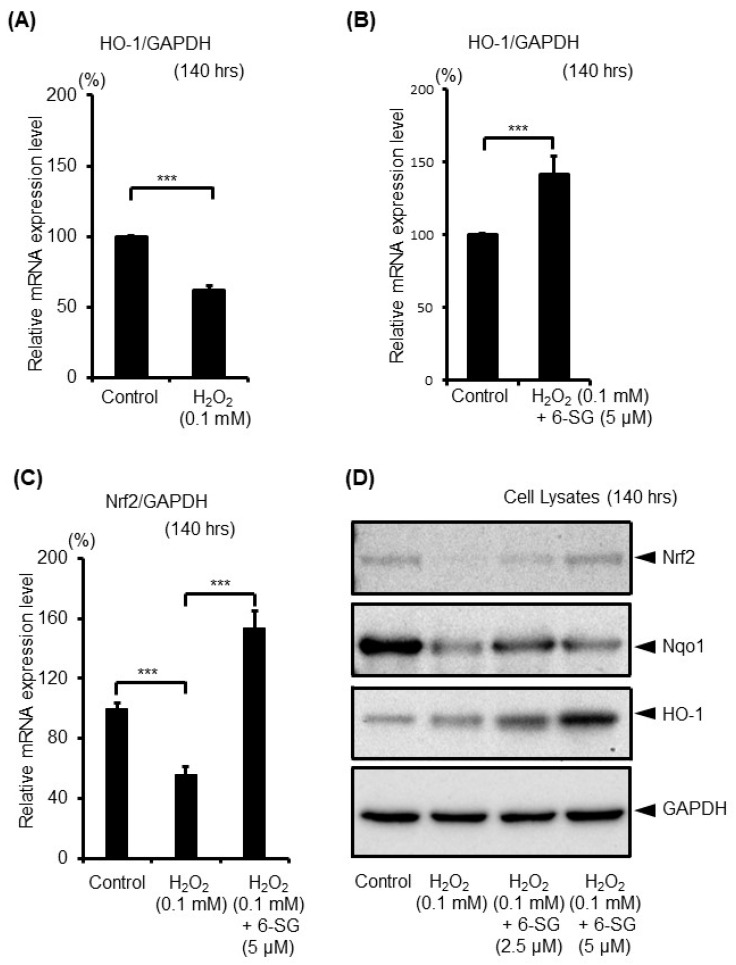
Figure 4.
Expression level of endogenous anti-oxidant response genes in cultured human epidermal melanocytes after exposure to the indicated treatments with 6-SG for 140 h. (A,B,C) mRNA expression analyses using real-time PCR; (D) Protein expression analyses using Western blot. Data in (A), (B) and (C) represent the results of three independent experiments. Data in (A), (B) and (C) are shown as mean ± SD, normalized to GAPDH. n.s., no significant difference; ***, p < 0.01. Representative Western blot (of three independent experiments performed) are shown, GAPDH was used as a loading control.

