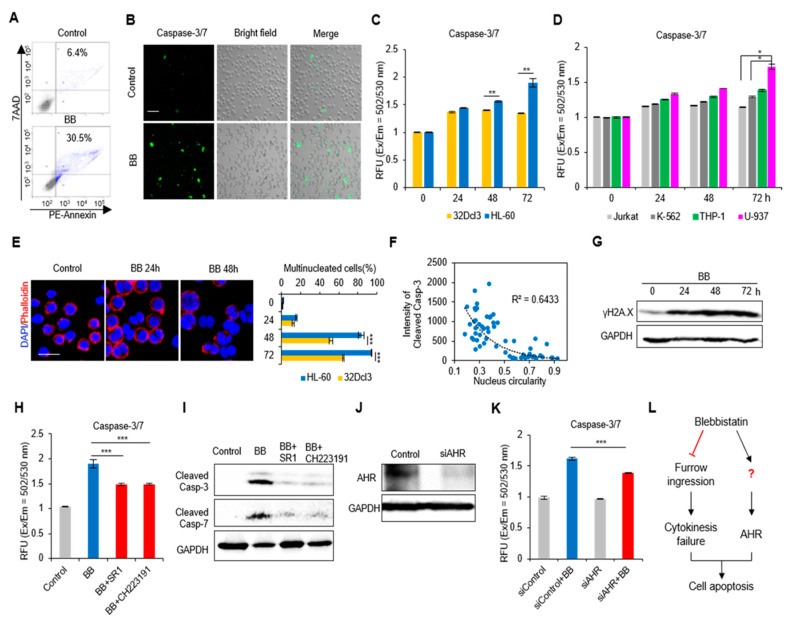
Figure 2.
Perturbation of actomyosin contractility effects apoptosis of AML cells. (A) Flow Cytometry analysis of cellular apoptosis after 24 h blebbistatin (BB, 50 µM) treatment. Annexin V+ cells are highlighted in blue color. (B) Immunofluorescence images of caspase-3/7 activity upon 50 µM blebbistatin treatment in HL-60 cells. (C) Quantification of caspase 3/7 apoptosis signal of 32Dcl3 and HL-60 cells after 50 µM blebbistatin treatment in a time-dependent manner. Data are measured as the fluorescence (Excitation / Emission = 502/530 nm) (n = 3). Data are represented as mean ± SEM. (D) Comparison of apoptosis level in Jurkat, K-562 with other AML cell lines (n = 6). Data are represented as mean ± SEM. (E) Left panel: representative images of cell multinucleation with blebbistatin treatment in HL-60 cells. Right panel: quantification of changes in multinucleation of 32Dcl3 and HL-60 cells over time (n = 3). Data are represented as mean ± SEM. (F) The correlation of cleaved caspase-3 expression with cell nucleus circularity (n = 62). (G) Immunoblotting of γH2A.X upon blebbistatin treatment in a time-dependent manner in HL-60 cells. (H) The effects of AHR antagonists (SR1 and CH223191) on blebbistatin induced HL-60 cell apoptosis (n = 6). Data are represented as mean ± SEM. (I) The effects of AHR antagonists on blebbistatin activated the caspase-3/7 apoptotic pathways. (J) The silencing efficiency of AHR siRNA. (K) The genetic perturbation of AHR affects blebbistatin induced HL-60 cell apoptosis (n = 6). Data are represented as mean ± SEM. (L) Experimental scheme of signaling nodes in blebbistatin induced HL-60 cell apoptosis. Scale bars: 50 µm (B), 20 µm (E). * p < 0.05, ** p < 0.01, *** p < 0.001.

