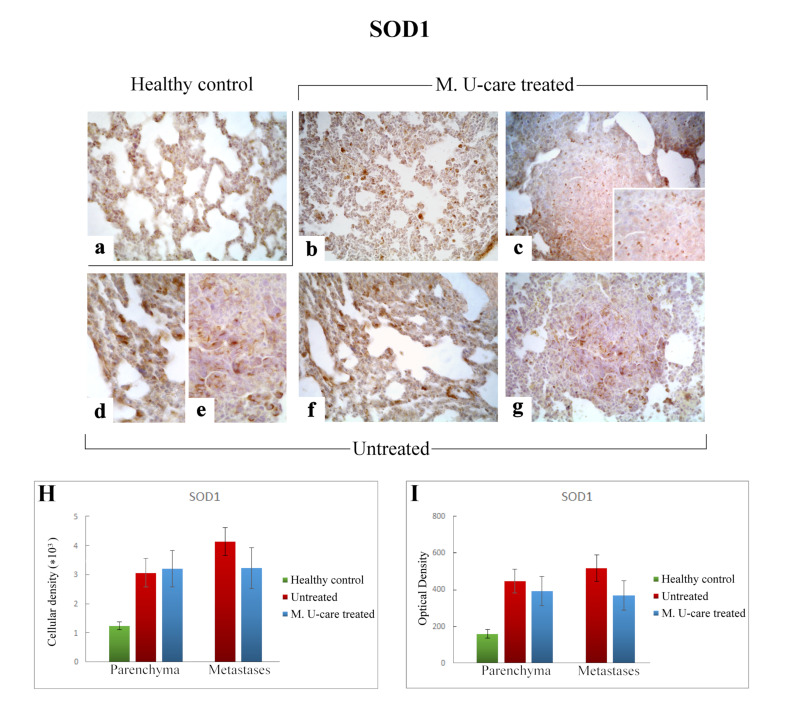
Figure 7.
Immunostaining pattern of SOD1 expression in healthy control (a), M. U-care–treated (b,c), and untreated (d–g) mice. A slightly more marked SOD1-immunoreactivity is observable in untreated animals (d–g), mainly detectable in alveolar pneumocytes, bronchiolar epithelial cells (d,f) and in metastatic tissue, also (e,g). M. U-care–treated mice display a weaker immunolabelling (b,c). Light microscopy magnification: 40× (a–c,f,g); 60× (d,e, insert in c). Histograms showing the quantitative analysis of immunoreactive cell density (H) and optical density (I), both in the parenchyma and metastatic tissue. p values calculated by one-way ANOVA followed by Bonferroni’s post-hoc test and unpaired Student’s t-test for parenchyma and metastases, respectively.

