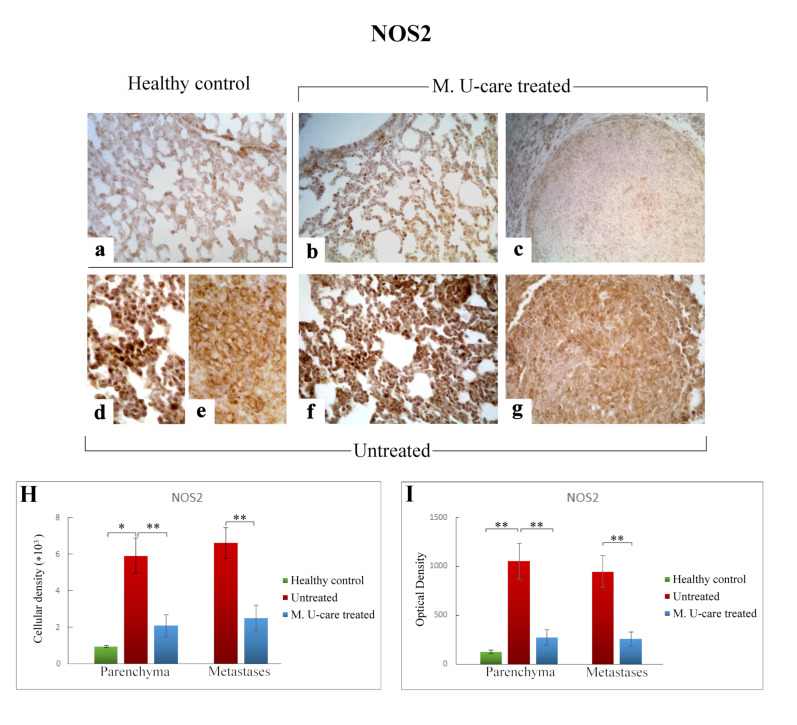
Figure 8.
Representative micrographs showing NOS2 expression, detected by immunohistochemistry, in healthy control (a), M. U-care–treated (b,c), and untreated (d–g) mice. An intensely marked NOS2-immunolabelling is clearly observable in untreated mice (d–g), with the strongest immunopositivity evident at bronchiolar and alveolar level (d,f) as well as in metastases (e,g). A weaker immunoreactivity is perceivable in M. U-care treated animals (b, c). Light microscopy magnification: 40× (a–c,f,g); 60× (d,e). Histograms illustrating of the quantitative analysis of immunopositive cell density (H) and optical density (I). p values calculated by one-way ANOVA followed by Bonferroni’s post-hoc test and unpaired Student’s t-test for parenchyma and metastases, respectively: (*) < 0.05; (**) < 0.01.

