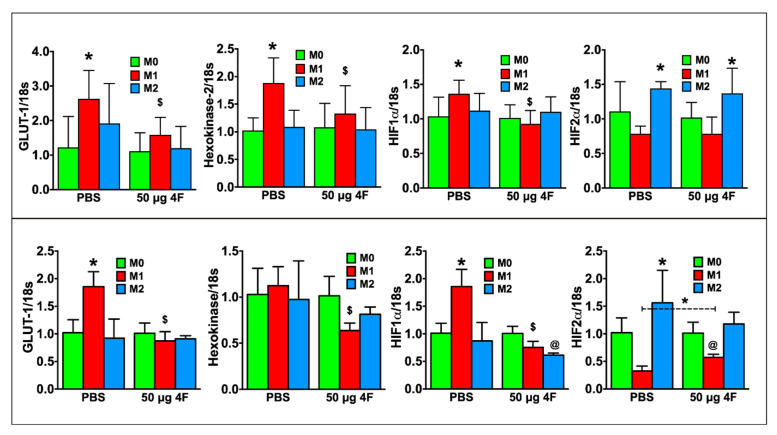
Figure 6.
L-4F attenuates M1 macrophage-associated metabolic gene profile in polarized macrophages. RT-PCR analysis of M1-macrophage associated metabolic genes from polarized RAW 264.7 cells (upper panels) or polarized mouse peritoneal macrophages (lower panels) after overnight treatment with either PBS or L-4F (50 μg/mL). Data are presented as fold changes (mean ± SD) and compared to non-polarized M0 macrophages. * p < 0.05 vs. respective M0; $ p < 0.05 vs. PBS-treated M1 group, @ p < 0.05 vs. respective M0 and M2 groups, n = 3/group each done in triplicate as in Figure 5.

