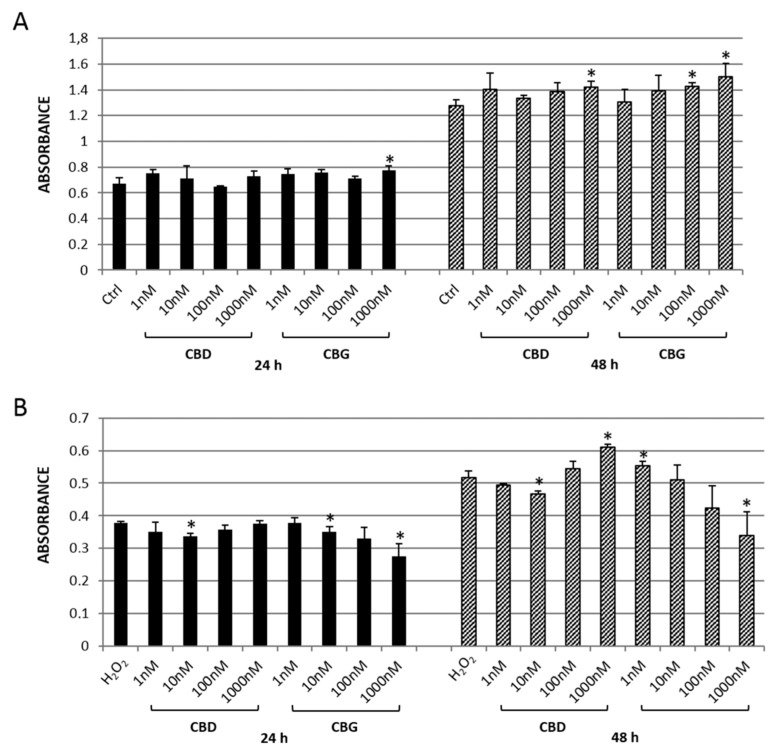
Figure 1.
MTT assay of CTX-TNA2 astrocyte cell line exposed to different concentrations (1–1000 nM) of either cannabidiol (CBD) or cannabigerol (CBG) for 24 (black bars) and 48 h (grey bars). (A) Cells in basal conditions. (B) Cells challenged with 300 µM H2O2. The data graph bars are the mean ± SD (n = 3). ANOVA, * p < 0.05 vs. control group.

