Figure 3.
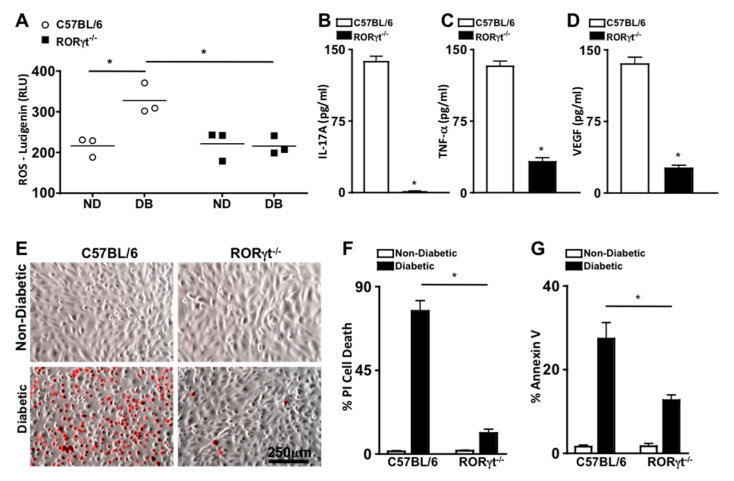
Oxidative stress, retinal inflammation, and endothelial cell death in retinas. (A) Quantification of reactive oxygen species (ROS) in the retinas of non-diabetic (ND) and diabetic (DB) C57BL/6 (white circles) and RORγt−/− (black squares) mice; each data point represents an individual retina (n = 3). ELISA quantifications of IL-17A (B), TNF-α (C), and VEGF (D) in retinas (n = 3) of diabetic C57BL/6 (white) and RORγt−/− (black) mice. ROS and inflammatory protein analysis were performed 2 months after diabetic conditions were confirmed. (E) Representative images of murine retinal endothelial cells (mREC) co-cultured with T cells of non-diabetic (top) and diabetic (bottom) C57BL/6 or RORγt−/− mice 48 h after incubation; dead red cells are Propidium iodide (PI) positive (scale bars of all images = 250 μm, which is a visual indicator of the size of the representative images). Flow cytometry quantifications of percent CD144+/PI+ cell death (F) or Annexin V+ apoptosis (G) in mREC co-cultured (n = 6) with T cells of non-diabetic (white) or diabetic (black) C57BL/6 or RORγt−/− mice. Percent positive cells are from analysis of 30,000 events. Error bars represent the SEM, and * p < 0.001 per unpaired student’s t-test.

