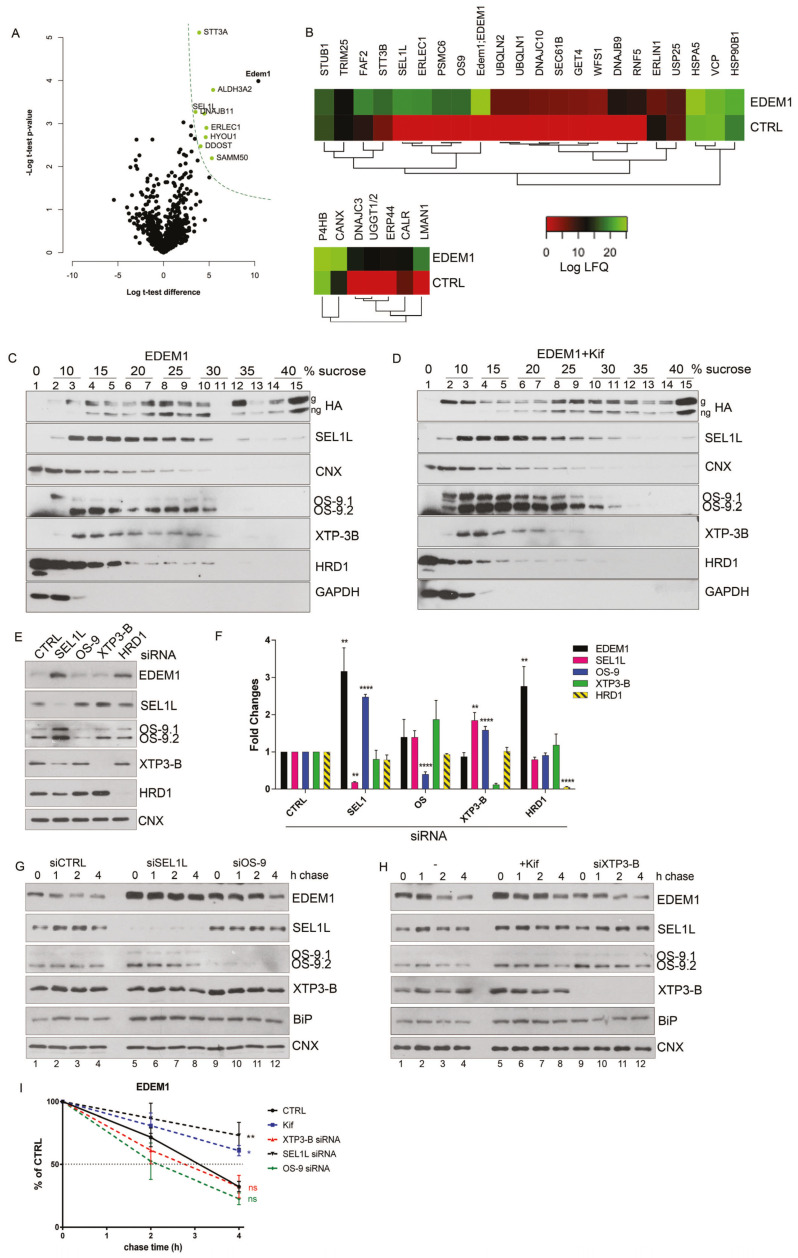
Figure 1.
EDEM1 (ER-degradation enhancing α-mannosidase-like) turnover is modulated by ERAD (endoplasmic reticulum-associated protein degradation) proteins. (A) Volcano plot of proteins identified using mass spectrometry after enrichment with anti-EDEM1 antibodies from HEK293T cells overexpressing an empty vector (CTRL) or EDEM1 lysed in Triton-X100-containing buffer. Peptides were identified for three biological replicates, assembled in protein groups using MaxQuant, and the label-free quantification (LFQ) values were exported for further analysis. A t-test with permutation-based FDR correction was applied to select the statistically significant proteins. Black points represent background proteins, and light green represent significant proteins. EDEM1 is represented in black and bold text. The dash line indicates the threshold for statistically significant proteins (p < 0.05 and a minimum log t-test difference of 4 was considered). (B): All the identified proteins were annotated with Gene Ontologies (GO) biological processes terms from UniProt database, and only entries that contained the ERAD (upper panel) and protein folding (lower panel) key terms were further kept for analysis. The colour key denotes the mean of biological triplicates after the log transformation of the intensity/LFQ values. (C,D): HEK293T cells overexpressing EDEM1 treated or not with kifunensine were lysed in a Triton-X100-containing buffer and cleared lysates were subjected to separation on a 10–40% sucrose gradient. Equal volumes of sucrose gradient fractions that were TCA-precipitated and resuspended in 4% SDS buffer, treated (D) or not (C) with kifunensine were separated in reducing conditions by SDS-PAGE, transferred onto nitrocellulose membranes, and probed with the indicated antibodies: HA (for detecting EDEM1 glycosylated (g) and non-glycosylated (ng) forms), SEL1L, calnexin (CNX), OS-9 (for detecting OS-9.1 and OS-9.2), XTP3-B, HRD1, and GAPDH. (E): HEK293T cells were transfected with siRNAs targeting a non-specific sequence (CTRL), alongside siRNA for SEL1L, OS-9, XTP3-B, and HRD1 for 72 h. Cells were harvested, lysed in Triton-X100-containing buffer and processed for SDS-PAGE in denaturing conditions; the proteins were transferred onto nitrocellulose membranes and probed with antibodies for EDEM1, SEL1L, OS-9 (detecting OS9.1 and OS9.2), XTP3-B, HRD1, and CNX as internal control. (F): Band densitometry of images present in (E) are represented as mean of 3 independent experiments (n = 3 ± SEM) and one-way ANOVA comparison with Bonferroni correction was applied for statistical analysis (* p < 0.05, ** p < 0.01, *** p < 0.001, and **** p < 0.001). For simplicity of representation, only statistically significant samples are indicated. (G and H): HEK293T cells were transfected with siRNA targeting a non-specific sequence (CTRL), or siRNA-targeting SEL1L, OS-9, and XTP3-B for 72 h and treated or not (-) with kifunensine (kif) (30 µM/ON); 48 h post transfection cells corresponding to each condition were divided in 4 individual dishes and incubated for another 24 h. Next, the medium was changed with fresh medium supplemented with 50 uM cycloheximide and harvested at the indicated time points. Cells were lysed in Triton-X100-containing buffer, and an equal amount of protein from each sample was prepared for SDS-PAGE in reducing conditions. The levels of endogenously expressed EDEM1, alongside SEL1L, OS-9, XTP3-B, BiP, and calnexin (CNX) were assessed by Western blotting. (G): The control (siCTRL), SEL1L (siSEL1L) and OS-9 (siOS-9) siRNA transfected samples. (H): Control (-), kifunensine (+kif) and XTP3-B (siXTP3-B) siRNA treated cells. (I): Densitometry plot of EDEM1 bands from (G) and (H), represented as mean of 3 independent experiments (n = 3 ± SEM), and one-way ANOVA comparison with Bonferroni correction was applied for statistical analysis (* p < 0.05, ** p < 0.01, *** p < 0.001, and **** p < 0.001).

