Figure 2.
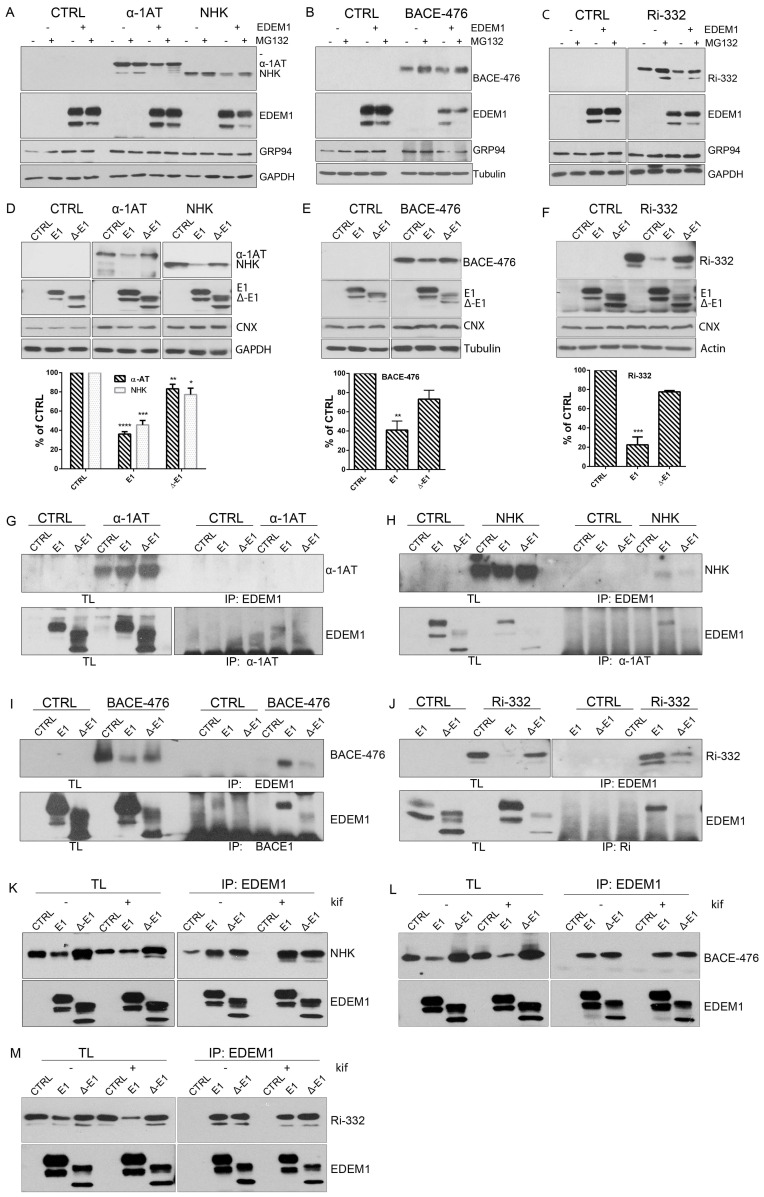
EDEM1 accelerates proteasomal degradation of ERAD substrates. (A) HEK293T cells co-expressing an empty vector (CTRL), α -1 antitrypsin (α-1AT), the Null Hong Kong (NHK) mutant with EDEM1, or an empty vector (-) were treated or not with MG132. The cells were lysed in Triton-X100-containing buffer, and an equal amount of protein was separated in polyacrylamide gels in reducing conditions for each sample. Protein expression was detected by Western blotting using antibodies against α-1AT that detected both the α-1AT wild type and NHK mutants, EDEM1, GRP94, or GAPDH. (B,C): The same experiment as in (A) was performed for BACE-476 (B) and Ri-332 (C). Proteins expression was detected by Western blotting using antibodies against BACE1 (B); ribophorin (C); EDEM1, GRP94, and tubulin (B); or GAPDH (C). (D): HEK293T cells co-expressing α-1AT or NHK with an empty vector (CTRL), EDEM1 (E1), or a ∆-EDEM1 (∆-E1) mutant were lysed in Triton-X100-containing buffer. An equal amount of protein from each sample was separated by SDS-PAGE, transferred onto nitrocellulose membrane, and probed with antibodies against α-1AT-detecting wild type form (α-1AT) and NHK mutants, EDEM1-detecting wild type (E1) and truncated (∆-E1) forms, calnexin (CNX), and GAPDH. The band densitometry of four independent experiments is presented in the graph to depict the level of α-1AT and NHK co-expressed with EDEM1 mutants (mean of n = 4 ± SEM), and two-way ANOVA comparison with Bonferroni correction was applied for statistical analysis (* p < 0.05, ** p < 0.01, *** p < 0.001, and **** p < 0.001). For simplicity only statistically significant samples are indicated. (E,F): Same experiment as for (D) was performed co-expressing BACE-476 (E) and Ri-332 (F) with an empty vector (CTRL), EDEM1 (E1) or ∆-EDEM1 (∆-E1) mutant and measured their expression by Western blotting, alongside CNX, tubulin (E), and actin (F). Band densitometry of 3 independent experiments is represented for each figure (mean n = 3 ± SEM), and two-way ANOVA comparison with Bonferroni correction was applied for statistical analysis (* p < 0.05, ** p < 0.01, *** p < 0.001, and **** p < 0.001). For simplicity of representation, only statistically significant samples are indicated. (G). HEK293T cells transiently transfected to co-express an empty vector (CTRL), EDEM1 (E1), and ∆-EDEM1(∆-E1) with α-1AT were lysed in CHAPS-containing buffer and the cell lysates were subjected to immunoprecipitation with antibodies for EDEM1 (upper panel) or α-1AT (lower panel). The eluted samples were separated by SDS-PAGE and probed with antibodies for the co-precipitated proteins. (H–J): Same as in (G) for NHK, BACE-476 and Ri-332, respectively, the eluted samples were separated by SDS-PAGE and probed with antibodies for the co-precipitated proteins α-1AT (H), BACE1 (I), Ribophorin I (J) (upper panels) and EDEM1 (lower panels). (K): HEK293T cells knock-out for EDEM1 were co-transfected with an empty vector (CTRL), EDEM1 (E1), ∆-EDEM1(∆-E1) and NHK, as in G and 24h after transfection kifunensine (kif) was added to half of the samples. Following, they were lysed in CHAPS-containing buffer, processed for immunoprecipitation with antibodies for EDEM1, and used for Western blotting with antibodies against α-1AT (upper panel) and EDEM1 (lower panel). (L) and (M) Same experiment as in (K) was performed for BACE-476 and Ri-332, respectively.

