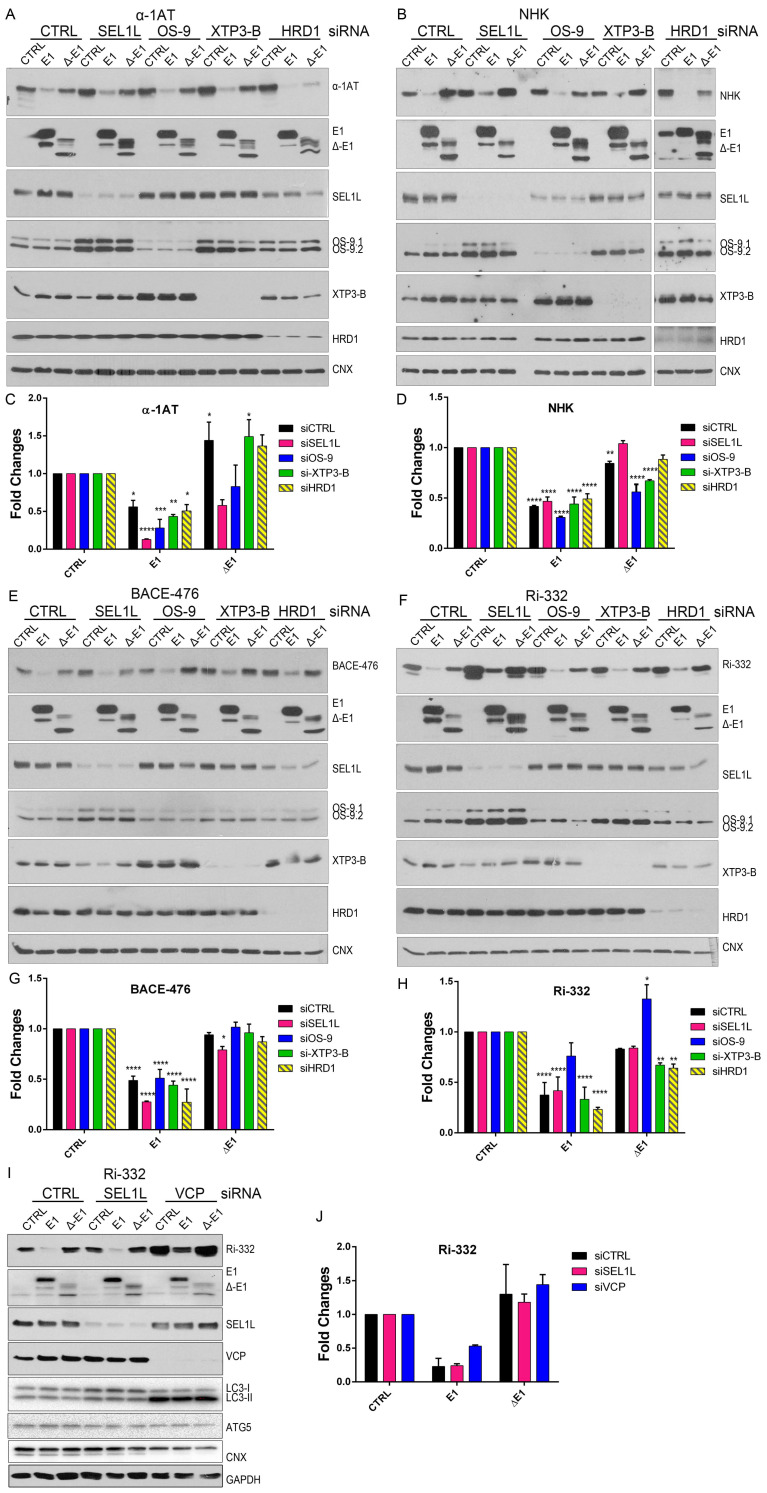
Figure 4.
EDEM1 accelerates the degradation of misfolded polypeptides even when ERAD is not functional. (A) HEK293T cells were transfected with siRNA targeting a non-specific sequence (CTRL), SEL1L, OS-9, XTP3-B, and HDR1 for 72 h; during the last 24 h, another transfection was made to overexpress an empty vector (CTRL), EDEM1 (E1), and ∆-EDEM1 (∆-E1), along with α-1AT. Cells were harvested, lysed in Triton-X 100-containing buffer, and an equal amount of protein from each sample was separated by SDS-PAGE in reducing conditions. Protein expression was estimated by Western blotting using antibodies against α-1AT, EDEM1, SEL1L, OS-9, XTP3-B, HRD1, and CNX as an internal control. (B): The same experiment was performed for NHK and its expression, and the above-mentioned proteins were detected by Western blotting. (C,D) Band densitometry plot of α-1AT and NHK presented in (A) and (B), respectively (mean n = 3 ± SEM), and two-way ANOVA comparison with Bonferroni correction was applied for statistical analysis (* p < 0.05, ** p < 0.01, *** p < 0.001, and **** p < 0.001). For simplicity only statistically significant samples are indicated. (E,F) During the last 24 h of siRNA transfection, BACE-476 and Ri-332 were co-expressed with an empty vector (CTRL), EDEM1 (E1), and ∆-EDEM1 (∆-E1) in HEK293T, in a similar experiment to that in (A). The protein expression was estimated by Western blotting using antibodies against BACE1 (E) and Ribophorin I (F) alongside EDEM1, SEL1L, OS-9, XTP3-B, HRD1, and CNX as an internal control. (G,H) Band densitometry plot of BACE-476 and Ri-332 presented in (E) and (F), respectively (mean n = 3 ± SEM), and two-way ANOVA comparison with Bonferroni correction was applied for statistical analysis (*p < 0.05, **p < 0.01, ***p < 0.001, and ****p < 0.001). For simplicity of representation, only statistically significant samples are indicated. (I): HEK293T cells were transfected with siRNA that targeted a non-specific sequence (CTRL), SEL1L, or p97/VCP for 72 h; during the last 24 h, the cells were transfected to co-express Ri-332 alongside an empty vector (CTRL), EDEM1(E1), and ∆-EDEM1 (∆-E1). Samples were processed as in (A), and the membranes were probed with antibodies for Ribophorin-I, EDEM1, SEL1L, VCP, LC3, ATG5, CNX, and GAPDH. (J): Band densitometry plot of Ri-332 is presented in (I) (mean n = 2 ± SEM).

