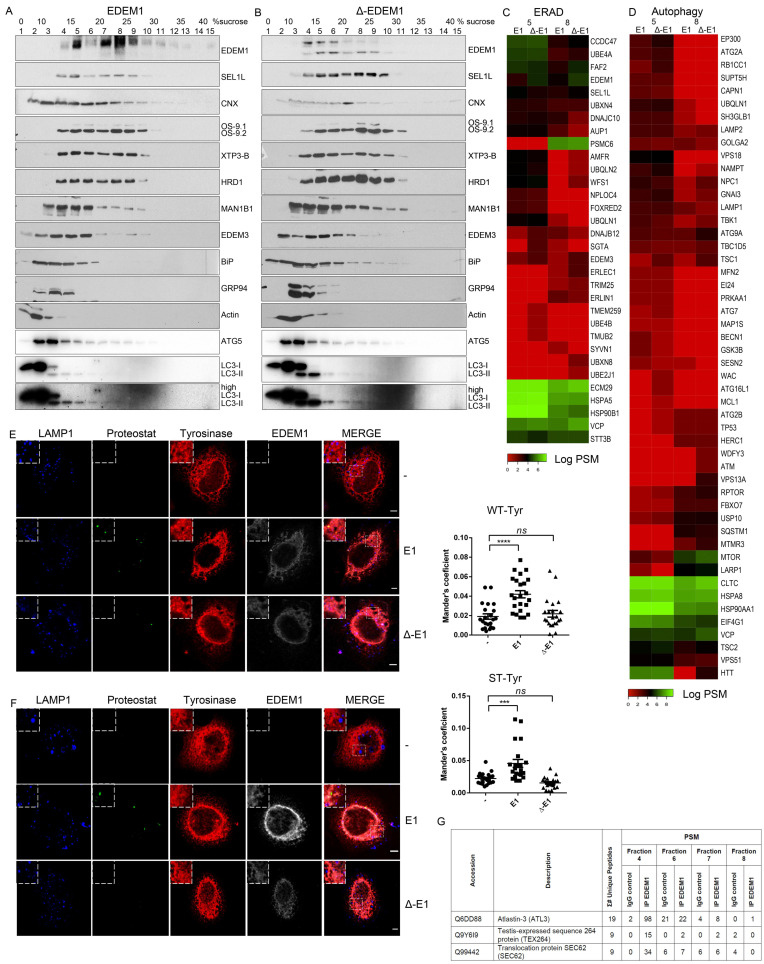
Figure 5.
EDEM1 induces the formation of aggregates and targets them for degradation by ER-phagy. (A,B) Cells overexpressing EDEM1 and ∆-EDEM1, respectively, were lysed in Digitonin-containing buffer, and cleared lysates were subjected to separation on a 10–40% sucrose gradient. Equal volumes of sucrose gradient fractions that were TCA-precipitated and resuspended in 4% SDS buffer were separated in reducing conditions by SDS-PAGE, transferred onto nitrocellulose membranes, and probed with antibodies against the indicated proteins: EDEM1, SEL1L, calnexin (CNX), OS-9, XTP3-B, HRD1, MAN1B1, EDEM3, BiP, GRP94, Actin, ATG5, and low exposure (LC3-I and II) and high exposure (high LC3-I and II) LC3. Heatmaps of ERAD (C) and autophagy (D) identified proteins using mass spectrometry in two sucrose gradient fractions, chosen based on EDEM1 expression as identified in (A) (2 maximum expression peaks that suggest 2 different complexes). TCA-precipitated proteins corresponding to each selected fraction (as shown by Western blotting), were separated by SDS-PAGE, followed by in-gel digestion protocol described in the Materials and Methods section, and subjected to LC–MS/MS analysis. Identified proteins were annotated with GO terms from UniProt and entries that contained the ERAD (C) and autophagy (D) key-terms were further kept for analysis. Heatmap of spectral counts distribution in log scale for the selected proteins is presented. (E) HeLa cells were co-transfected with WT-tyrosinase (WT-Tyr) and an empty vector (-), EDEM1 (E1), or ∆-EDEM1 (∆-E1); 24 h post-transfection, cells were fixed with 1% PFA for 1h and processed as described in the Materials and Methods section. Confocal images for LAMP1, Proteostat, tyrosinase, and EDEM1 are presented; the scale bar represents 5 µM. The co-localization between tyrosinase and Proteostat was evaluated by calculating Mander’s correlation coefficient using the JACoP plugin (mean n = 20 ± SEM). Two-way ANOVA comparison with Bonferroni correction was applied for statistical analysis (* p < 0.05, ** p < 0.01, *** p < 0.001, and **** p < 0.001; ns—non-significant). Insets of 10.5 μM (zoom image on the indicated area) are inserted in each picture for a higher magnification. (F): The same experiment as in (E) was performed for the soluble form of tyrosinase (ST-Tyr) and the co-localization of ST with Proteostat was evaluated, a mean of n = 19 ± SEM is represented graphically, and two-way ANOVA comparison with Bonferroni correction was applied for statistical analysis (* p < 0.05, ** p < 0.01, *** p < 0.001, and **** p < 0.001; ns—non significant). Insets of 10.5 μM (zoom image on the indicated area) are added to each image for a higher magnification. (G): This depicts peptide spectrum matches (PSMs) and the total number of unique peptides identified for three of the six reported ER-phagy receptors that were identified after immunoprecipitation with EDEM1 and the LC-MS/MS detections of sucrose gradient fractions, processed as described in the Materials and Methods section.

