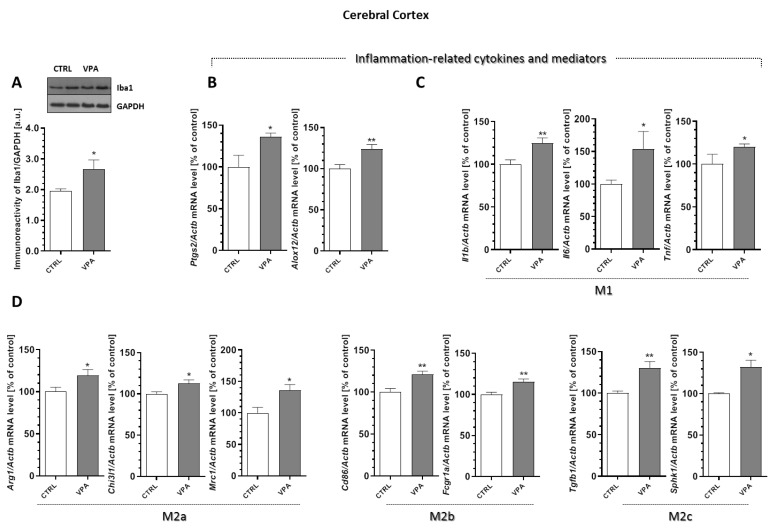
Figure 10.
The effect of prenatal exposure to VPA on the status of microglia in the cerebral cortex. (A) The immunoreactivity of Iba-1 was monitored using a Western blot analysis. Densitometric analysis and representative pictures are shown. Results were normalized to GAPDH levels. Data represent the mean values ± SEM from n = (8–11) independent experiments. The gene expression of Ptgs2, Alox12 (B); Il1b, Il6, and Tnf (C); and the markers of the M2 phenotype’s microglia activation: Arg1, Chi3l1, Mrc1, Cd86, Fcgr1α, Tgfb1, and Sphk1 (D) in the cerebral cortex of the control and VPA-exposed rats were measured with quantitative RT-PCR and calculated by the ΔΔCt method with Actb (β-actin) as a reference gene. Data represent the mean values ± SEM for n = (3–6) independent experiments. * p < 0.5, ** p < 0.01 vs. control.

