. 2020 May 21;17:E36. doi: 10.5888/pcd17.200020

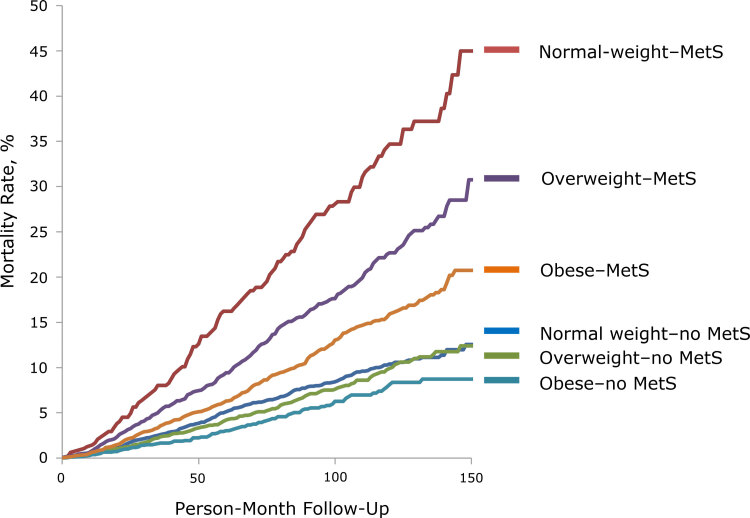
Figure 1.

Log rank test showed significantly higher mortality among the overweight–MetS group than the obese–MetS group (P < .001) and significantly higher mortality among the normal-weight–MetS group than the overweight–MetS group (P < .001). At 150-month follow-up, the mortality rates were as follows: normal-MetS, 45.0%; overweight-MetS, 30.7%, obese-MetS, 20.7%; normal weight–no MetS, 12.6%; overweight–no MetS, 12.4%; and obese–no Met S, 8.7%.

Unadjusted mortality curve during 150 person-month follow-up for each MetS–BMI category, National Health and Nutrition Examination Survey, 1999–2010, and National Death Index, 2011. Abbreviation: BMI, body mass index; MetS, metabolic syndrome.