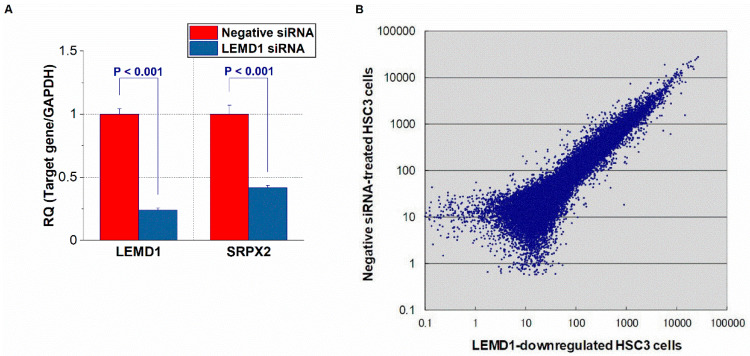
Figure 1.
Microarray analysis of HSC3 cells with suppressed LEM domain containig 1 (LEMD1) expression. (A) Expression of LEMD1 in control HSC3 cells and HSC3 cells with down regulation of LEMD1. (B) Scatter plot of gene variation in HSC3 cells and LEMD1-downregulated HSC3 cells in the microarray analysis. p value < 0.05 was regarded ad statistically significant.

