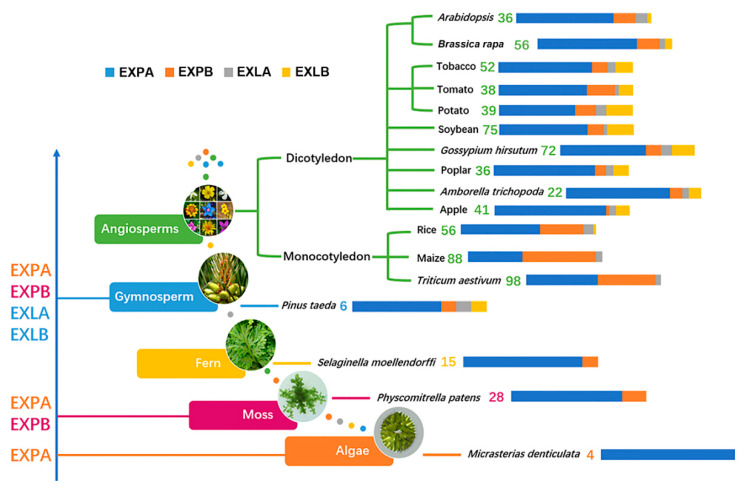
Figure 1.
Evolutionary analyses of expansin genes, numbers of family members, and proportions of different subfamilies in representing species. Different subfamilies emerged at different periods during evolution, with appearance times indicated by blue arrows on the left. Expansin family members are shown for different species, with changes in the proportions of different subfamilies. Different bar lengths represent different proportions of subfamilies. The numbers of family members in representative species are from reported studies. References are the same as in Table 1.

