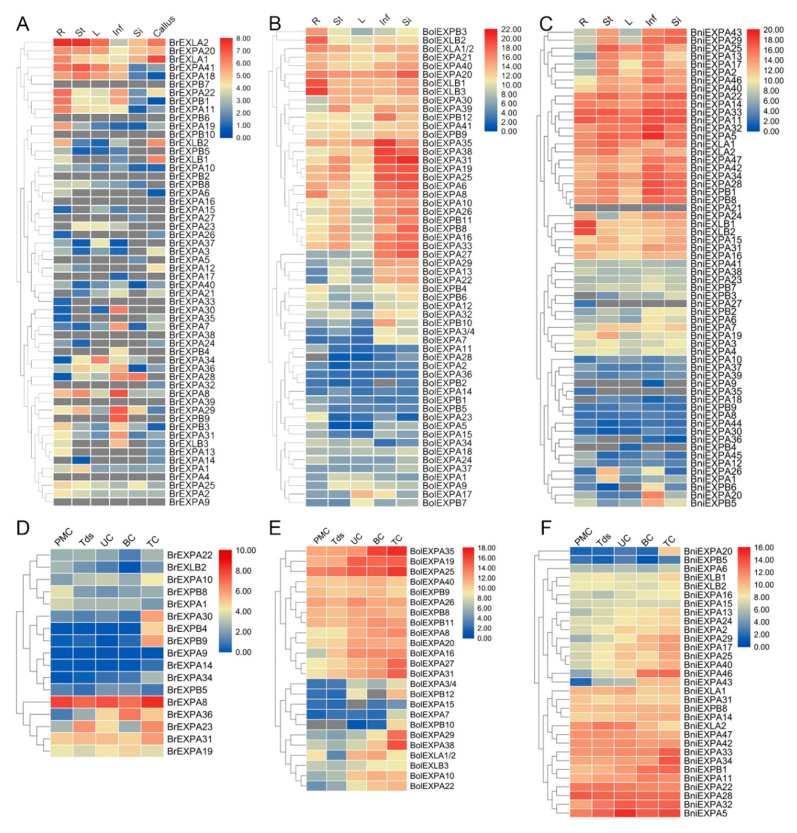
Figure 10.
Hierarchical clustering and heat map generated by TBtools showing the expression levels of expansin genes in six or five tissues and different development stages of pollen in B. rapa (A,D), B. oleracea (B,E), and B. nigra (C,F). The scale bars represent relative expression level. The grey box designates undetectable expression. R roots, St stems, L leaves, Si siliques, Inf inflorescences, PMC pollen mother cell, Tds tetrads, UC uninuclear pollen, BC binucleate pollen, TC trinucleate pollen.

