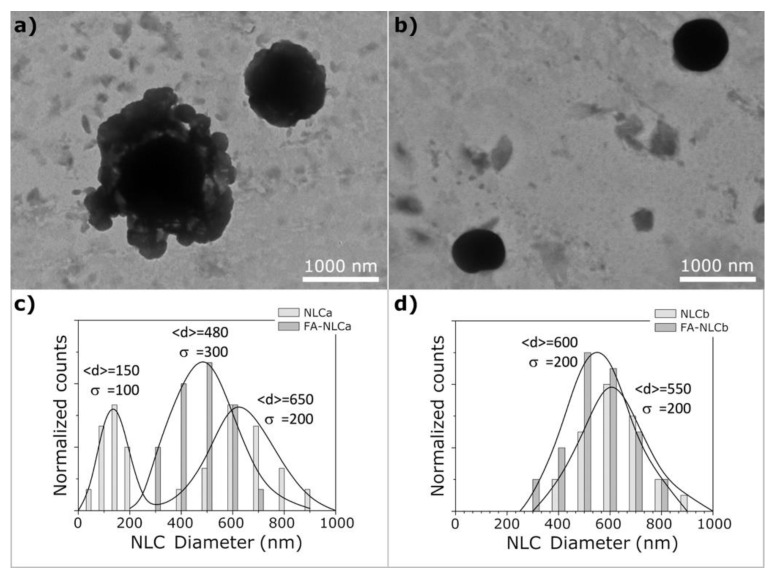
Figure 2.
Transmission electron microscopy (TEM) images of NLCa (a) and NLCb (b). The histograms show the size distribution of the lipid nanoparticles in NLCa (c) and NLCb (d); continuous curves represent the Gaussian fit of experimental data and the parameters <d> (mean diameter) and σ (standard deviation) are also reported.

