Figure 1.
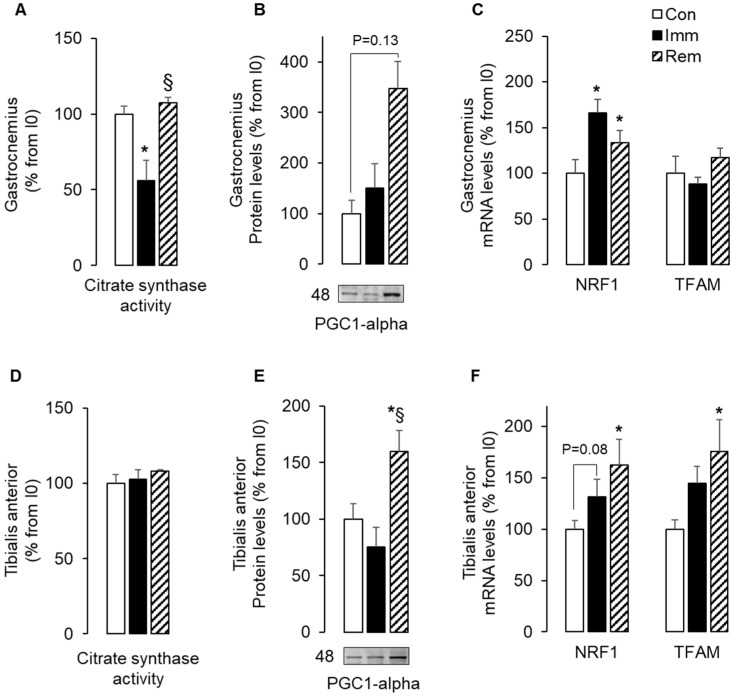
The expression of mitochondria biogenesis markers increased during remobilization. Citrate synthase activity was measured in the gastrocnemius (GA) (A) and the tibialis anterior (TA) (D), as described in Section 4. Protein levels for PGC-1α were assessed by Western blots in the GA (B) and the TA (E), quantified and normalized using Ponceau red staining for uneven loading. Representative Western blots are shown below each graph, and molecular weights are given in kDa. mRNA levels for NRF1 and TFAM were measured in the GA (C) and the TA (F) by RT-qPCR. Data were normalized using 18S rRNA. Protein and mRNA levels were expressed as % from the Con group. Statistical differences were assessed by ANOVA, as described in Materials and Methods. * p < 0.05 vs. Con, § p < 0.05 vs. Imm; Con, non-immobilized rats; Imm, immobilized; Rem, remobilized.

