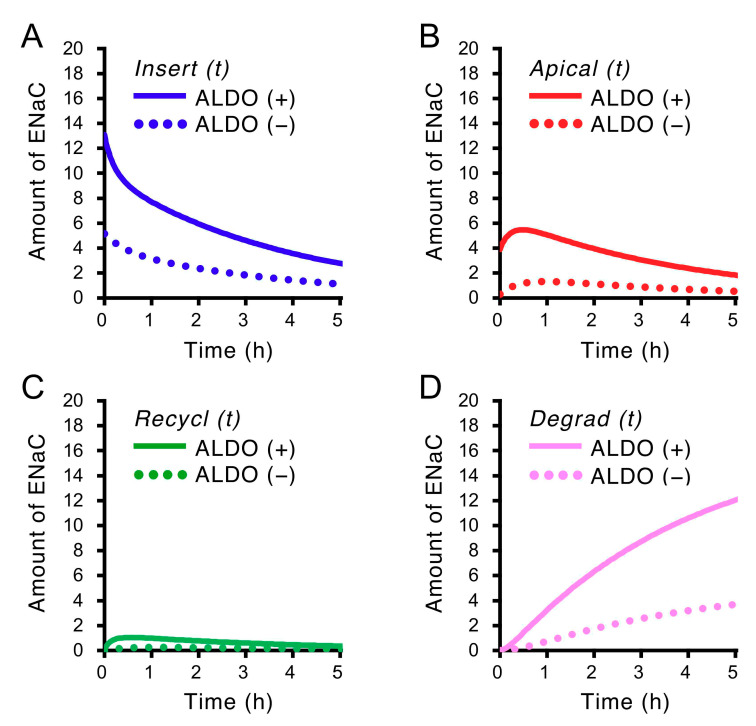
Figure 3.
Insulin-induced time-dependent changes in the amounts of ENaC localized in four states, Insert, Apical, Recycl, and Degrad, shown in Figure 1 in cells treated with and without aldosterone (ALDO, 1 µM for 20 h). The amounts of ENaC localized in each state under aldosterone-treated and -untreated conditions are respectively shown by solid (with aldosterone treatment: ALDO (+)) and dot (without aldosterone treatment: ALDO (–)) lines. A, an insertion state (Insert); B, an apical membrane state (Apical); C, a recycling state (Recycl); D, a degradation state (Degrad) as shown in Figure 1. (A) (blue lines) shows the amount of ENaC in an insertion state, Insert, at time = : (B) (red lines), the amount of ENaC in an apical membrane state, Apical, at time = : (C) (green lines), the amount of ENaC in a recycling state, Recycl, at time = : (D) (pink lines), the amount of ENaC in a degradation state, Degrad, at time = . is the time elapsed after application of 100 nM insulin to the basolateral solution. , , and respectively represented by Equations (5)–(8) are described using the values of , , , and determined by fitting to the experimentally measured ISC.

