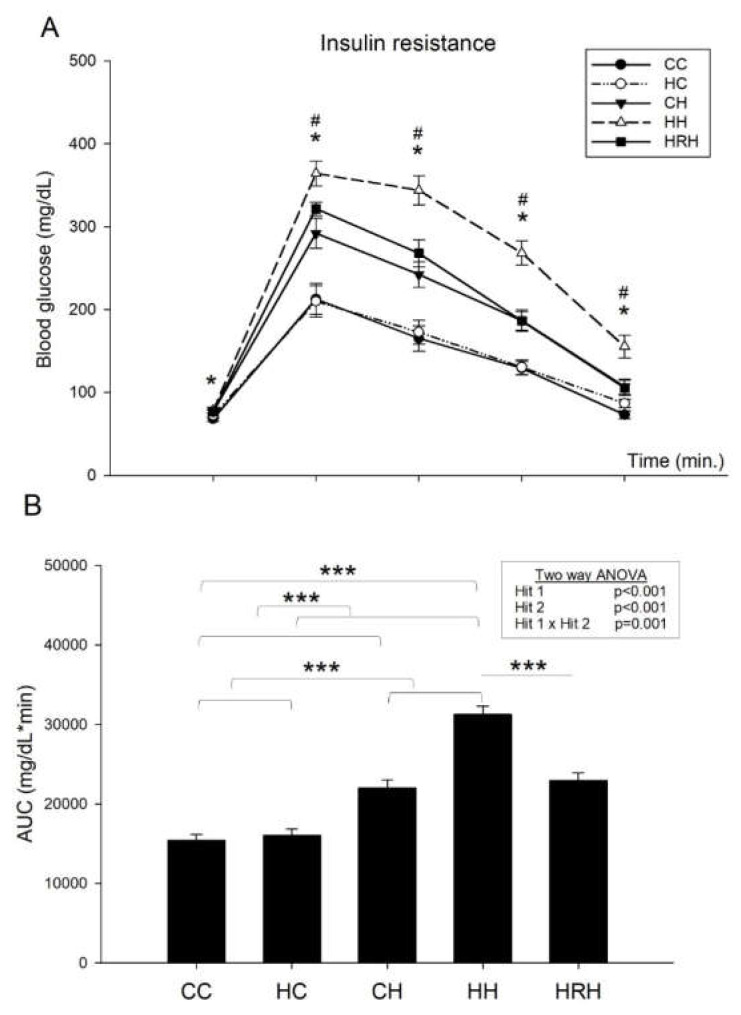
Figure 5.
Plasma glucose levels of post-stimulation tests. (A) Intraperitoneal glucose tolerance test. * p < 0.05 CC vs. HH; # p < 0.05 HH vs. HRH (B) Glucose area under the curve (AUC). Data were analyzed using two-way ANOVA (maternal diet x post-weaning diet), and the therapeutic effect of resveratrol was evaluated using the Student’s t-test. Maternal HFD/obesity treatment in AUC: (F (1,42) = 16.791, p < 0.001). Postnatal HFD treatment in AUC: (F (1,42) = 82.249, p < 0.001). An interaction effect between maternal HFD/obesity and postnatal HFD in AUC: (F (1,42) = 12.790, p = 0.001). *** p < 0.001.

