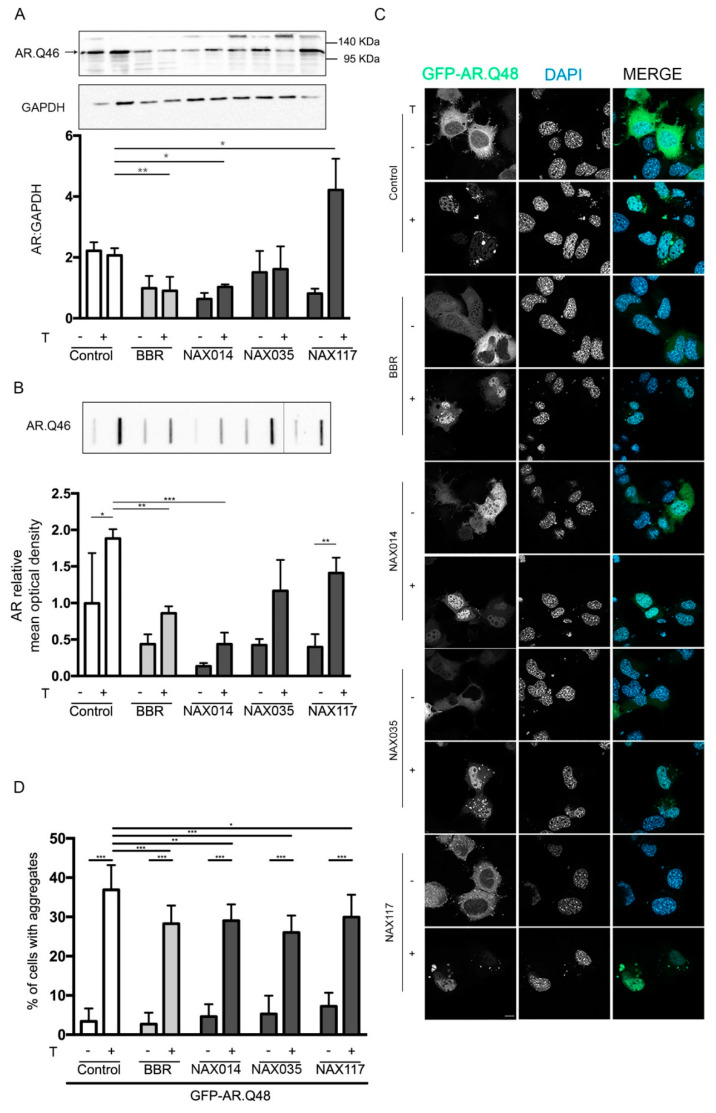
Figure 3.
Effects of NAXs on ARpolyQ. (A,B) NSC34 cells were transfected with AR.Q46 in absence or in presence of 10 nM of testosterone and treated with BBR or NAX compounds for 48 h (BBR, NAX014 and NAX035 were used at 0.2 μM, NAX117 was used at 0.5 μM). (A) WB analysis was performed, GAPDH was used as loading control, the bar graph represents the mean optical density ± SD of AR: GAPDH (n = 3) (* p < 0.05, ** p < 0.01, two-way ANOVA, followed by Tukey’s test). (B) FRA was performed. The bar graph represents the mean optical density of AR ± SD (n = 3) (* p < 0.05, ** p < 0.01, *** p < 0.001, two-way ANOVA, followed by Tukey’s test). (C,D) Fluorescence microscope analysis performed on NSC34 cells transfected with GFP-ARQ48 in absence or in presence of 10 nM testosterone and treated BBR or NAX compounds for 48 h (BBR, NAX014 and NAX035 were used at 0.2 μM, NAX117 was used at 0.5 μM). (C) Representative fluorescence microscopy analysis of GFP-AR.Q48 protein levels. Nuclei were stained with DAPI (63X magnification). Scale bar: 10 μM. (D) The quantification of GFP-AR.Q48 aggregates was performed using a PL 10X/20 eyepiece with graticules. The percentage of cells with aggregates was obtained dividing the number of cells with aggregates with the total number of GFP positive cells (* p < 0.05, ** p < 0.01, *** p < 0.001, two-way ANOVA, followed by Tukey’s test).

