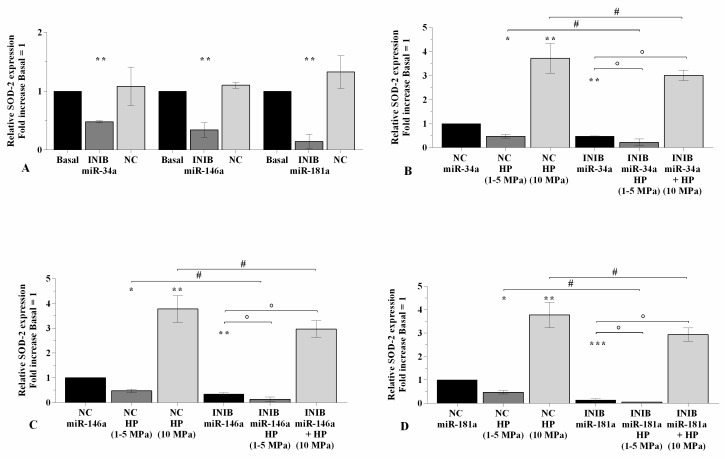
Figure 7.
miRNA silencing regulates SOD-2 expression following HP exposure. (A–D) Expression levels of SOD-2 analyzed by real-time PCR. Human OA chondrocytes were evaluated at basal condition, after 24~h of transfection with miR-34a, miR-146a, and miR-181a inhibitors (50 nM) or NC (5 nM), and after 3~h of low sinusoidal (1–5 MPa) or static continuous (10 MPa) HP exposure. The gene expression was referenced to the ratio of the value of interest and the value of basal condition or NC, reported equal to 1. Data were expressed as mean ± SD of triplicate values. * p < 0.05, ** p < 0.01, *** p < 0.001 versus basal condition or NC. ° p < 0.05 versus inhibitor. # p < 0.05 versus HP. INIB = Inhibitor, NC = negative control siRNA.

