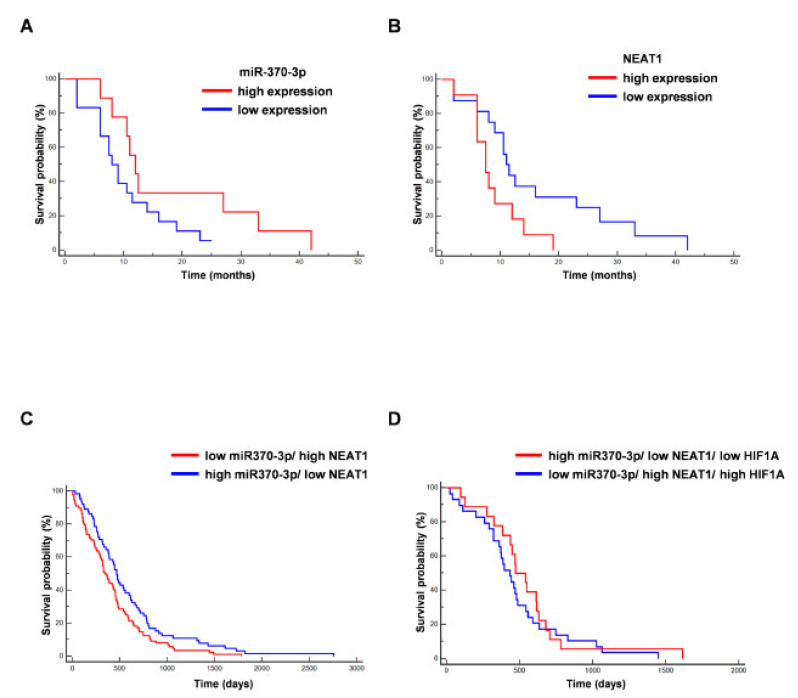
Figure 5.
Correlation between miR-370-3p and NEAT1 expression and overall survival (OS) of GBM patients. (A) Kaplan–Meier curve for OS in our cohort of GBM patients stratified for low miR-370-3p expression (<the median value) vs high miR-370-3p expression (>the median value). The last group was not associated to a better outcome (n = 27, p = 0.09, Hazard Ratio (HR) 0.4778, 95% CI from 0.2029 to 1.1253). (B) Kaplan–Meier curve for OS in our cohort of GBM patients stratified for low NEAT1 expression (<the median value) vs. high NEAT1 expression (>the median value). The last group was significantly associated to a worse outcome (n = 27, p = 0.035, HR 2.7980, 95% CI from 1.0754 to 7.2804). (C) Kaplan–Meier curve for OS in GBM The Cancer Genome Atlas (TCGA) patients stratified for low miR-370-3p/ high NEAT1 vs. high miR-370-3p/ low NEAT1. The last group was significantly associated to a better outcome (n = 153, p = 0.0215, HR 0.6855, 95% CI from 0.4968 to 0.9458). (D) Kaplan–Meier curve for OS in GBM TCGA patients stratified for low miR-370-3p/high NEAT1/high HIF1A vs high miR-370-3p/low NEAT1/low HIF1A (n = 47, p = 0.4400, HR 0.7927, 95% CI from 0.4395 to 1.4296).

