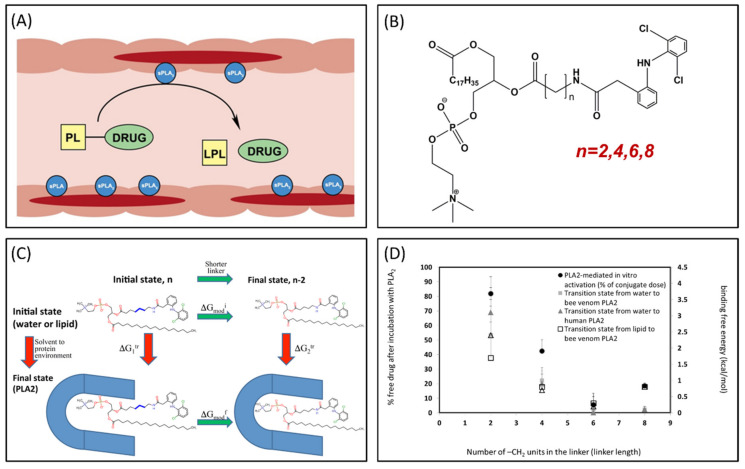
Figure 4.
(A) Illustration of phospholipid (PL)-prodrug activation in phospholipase A2 (PLA2)-rich inflamed intestinal tissues of Inflammatory Bowel Disease (IBD) patients; (B) Structure of PL-diclofenac prodrug; (C) Thermodynamic cycle used for relative binding free energy calculations of PL-diclofenac prodrugs in the transition state complex of PLA2; and (D) In vitro/in silico correlation: binding free energies in PLA2transition state (kcal/mol) vs. in vitro activation for different PL-diclofenac prodrugs (% of intact complex). Reproduced with permission from [37,40].

