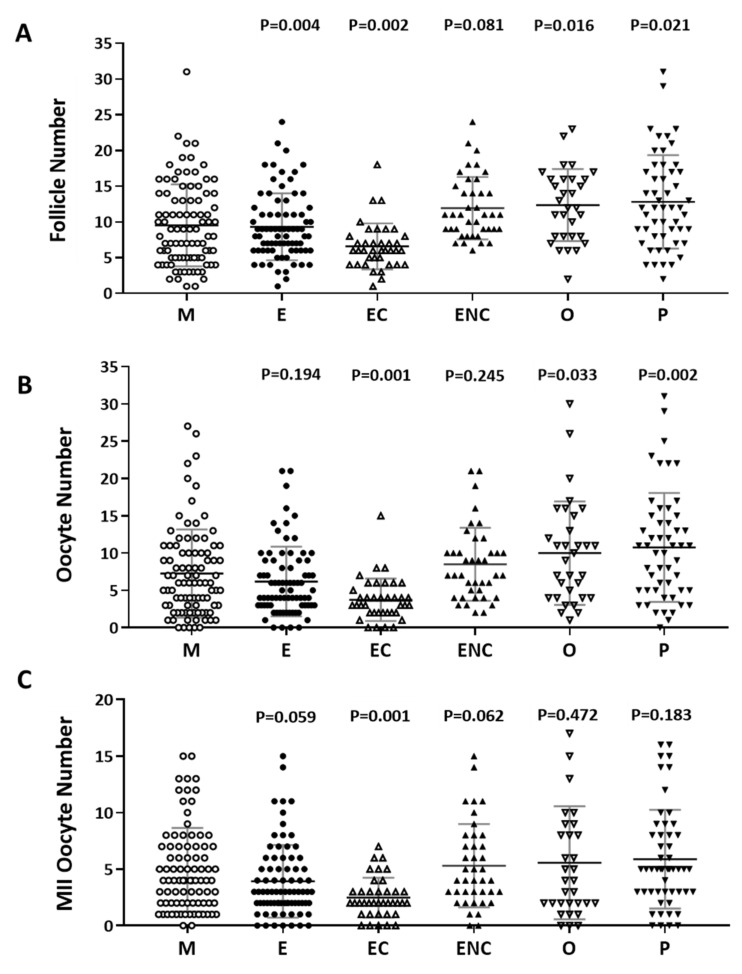
Figure 2.
Comparison of oocyte quality and quantity in the different groups as an indication of infertility. The (A) follicle number, (B) oocyte number, and (C) number of mature oocytes (metaphase II) from all infertility patient groups. The infertile individuals were grouped into six groups: male factor (as control group, M), endometriosis (E), ovarian endometrioma (EC), endometriosis without ovarian endometrioma (ENC), other female factors (O), and polycystic ovary syndrome (P). The p-value for each group versus the male factor group was determined by an unpaired t-test.

