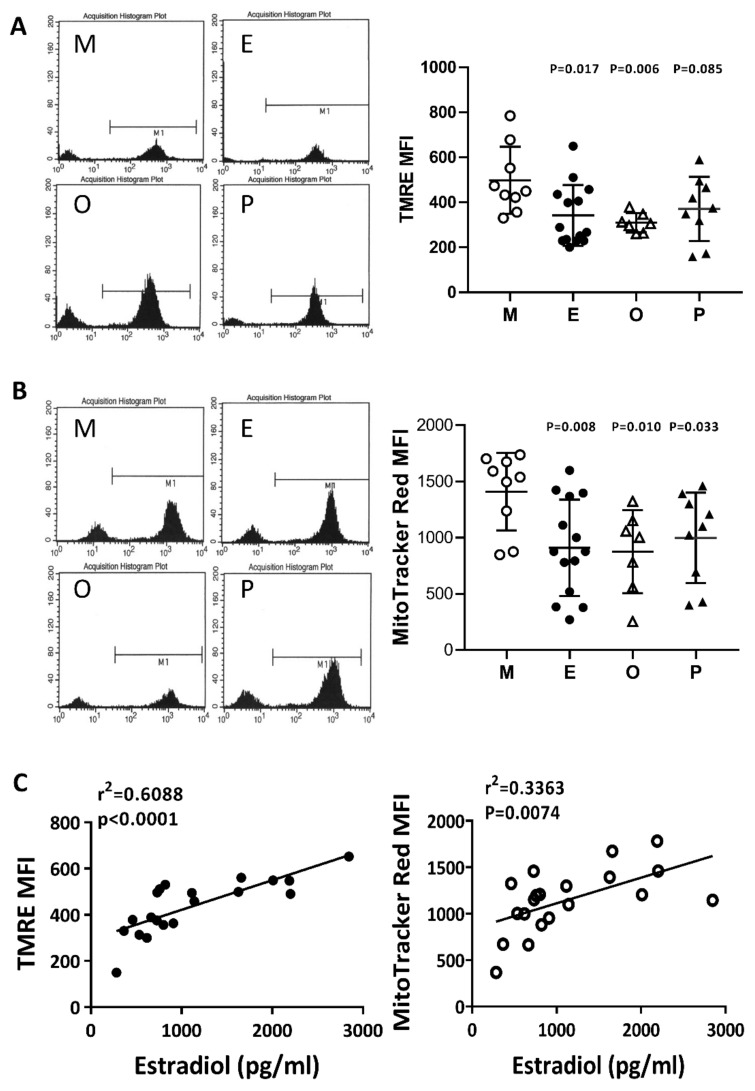
Figure 6.
Comparison of mitochondrial membrane potential in the various infertile groups. The mitochondrial membrane potential was measured by (A) N, N, N’, N’-tetramethyl-ethylenediamine (TMRE) and (B) MitoTracker Red staining and measured by flow cytometry. (C) The relationships between the mitochondrial membrane potential (TMRE or MitoTracker Red) and the serum E2 content were assessed by linear regression.

