Figure 2.
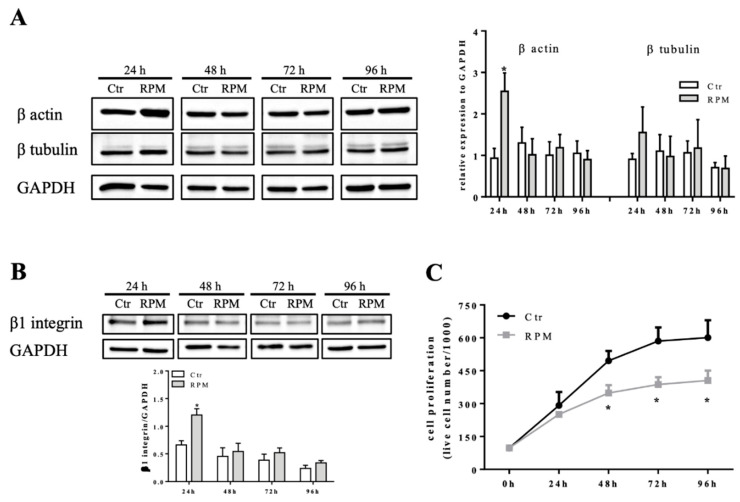
Modulation of cell mechanosensors and proliferation. (A,B) Representative immunoblots of β actin, β tubulin, and β1 integrin expression levels in extracts from control cells at 1g (Ctr) or cells exposed to s-microgravity (RPM) at different exposure times (24–96 h). The densitometric analyses are plotted as the relative expression calculated as a ratio between the optical density (OD) × mm2 of each band and OD × mm2 of the corresponding GAPDH band, used as loading control. (C) Cell proliferation tested on Ctr and RPM-exposed cells at different exposure times (24–96 h). The data are presented as the means ± SEM from three independent experiments. * p < 0.05 vs. Ctr.

