Figure 2.
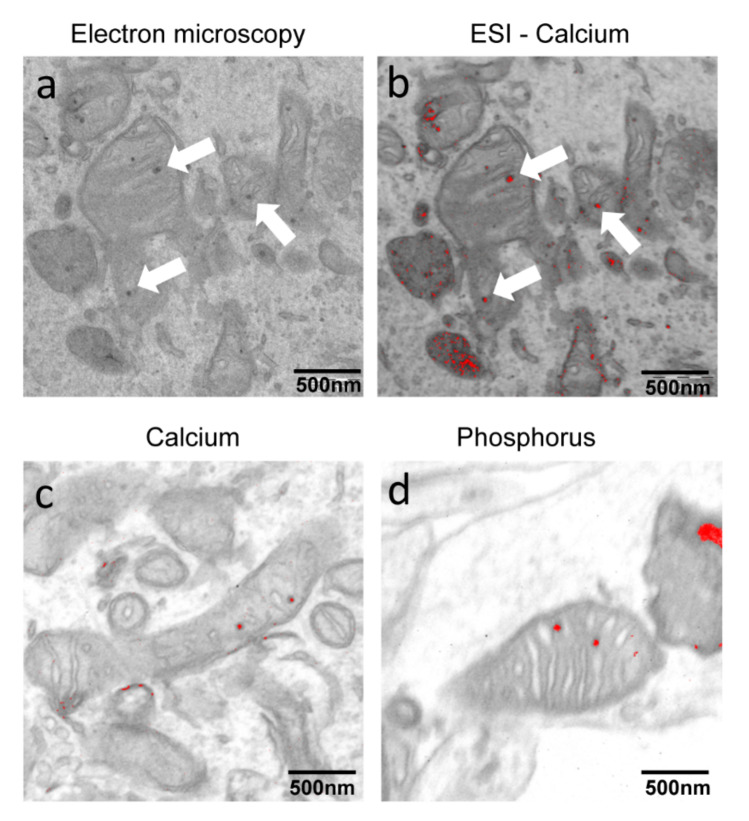
Electron spectroscopic imaging (ESI) analysis on PKAN iPS-derived neurons. (a) Representative images of ultrastructural analysis of mitochondria from fixed iPS-derived neurons examined with electron microscope. (b) Overlapping of the map obtained by ESI in which calcium is evidenced in red and of the same field visible in A. (c,d) Overlapping of the map obtained by ESI analysis in which calcium or phosphorus are respectively evidenced in red. Arrows point to electron dense granules present in mitochondria. Scale bar 500 nm.

