Figure 4.
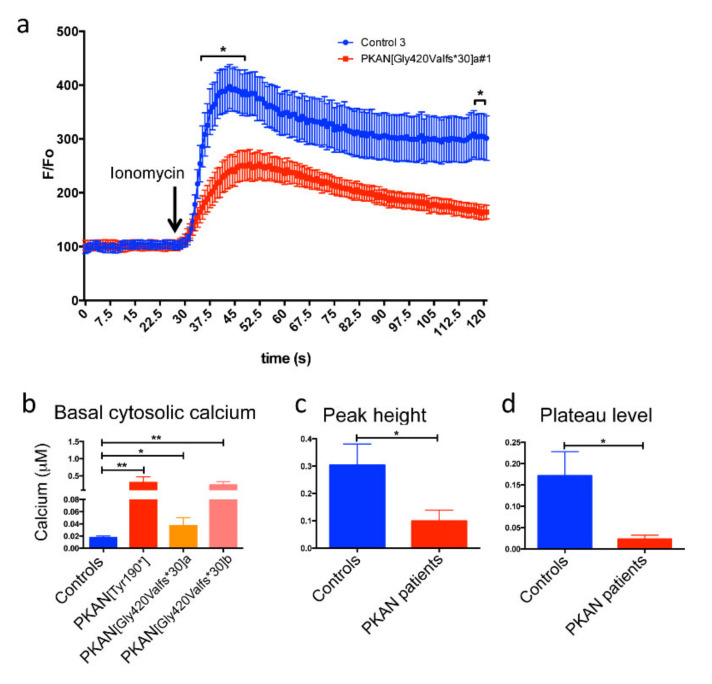
Fura Red qualitative/quantitative analysis of the cytosolic calcium content in iPS-derived neurons. (a) An example of graph of the analysis with the Fura Red AM probe in control and PKAN [Gly420Valfs*30]a iPS derived-neurons. (b) Graph showing the cytosolic calcium concentration in basal conditions obtained by measuring the fluorescence ratio of Fura Red following excitation at 405/488 nm and calculated on a calibration curve. (c) Graph showing the levels of cytosolic calcium, after addition of ionomycin, obtained by measuring the increase in fluorescence at the peak compared to baseline. (d) Graph showing the levels of cytosolic calcium, after addition of ionomycin, obtained by measuring the increase in fluorescence at the plateau compared to baseline. The statistical analysis was done using in a two-way ANOVA; in (b) one-way ANOVA; in (c) and (d) Student’s t-test: * p < 0.05, ** p < 0.01. All data are presented as mean + SEM on at least three independent replicates.

