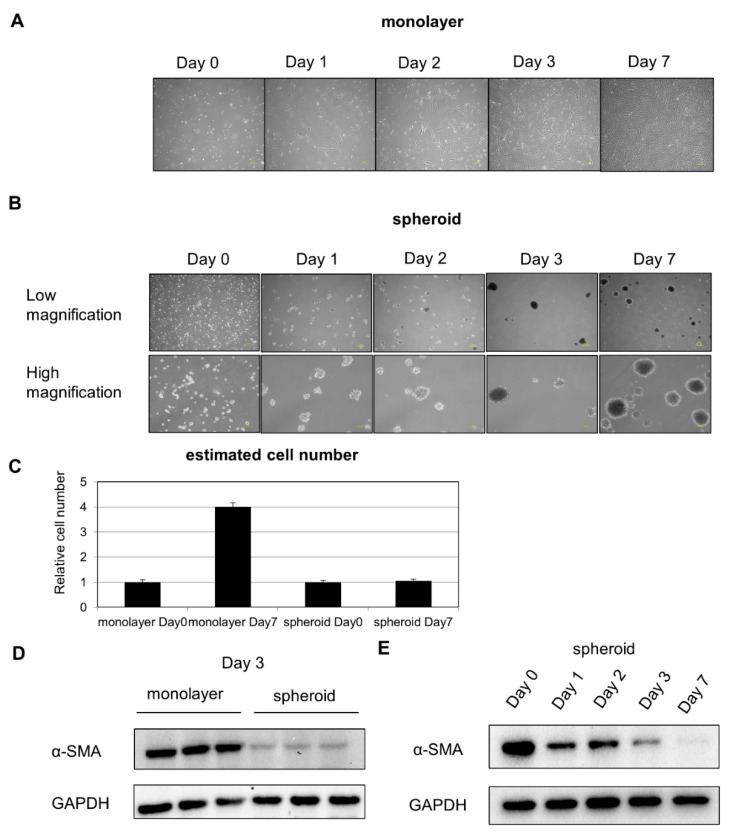
Figure 1.
HSC composition over time in monolayer and spheroid cultures: (A) changes over time in HSCs in monolayer culture, 200 μm scale. (B) Changes over time in HSCs in spheroid culture. Upper panel: low power, 200 μm scale. Lower panel: high power, 100 μm scale. (C) Comparison of cell number on Day 0 and Day 7. (D) α-SMA expression in monolayer and spheroid cultures, Day 3. (E) Changes in α-SMA expression over time in the spheroid culture.

