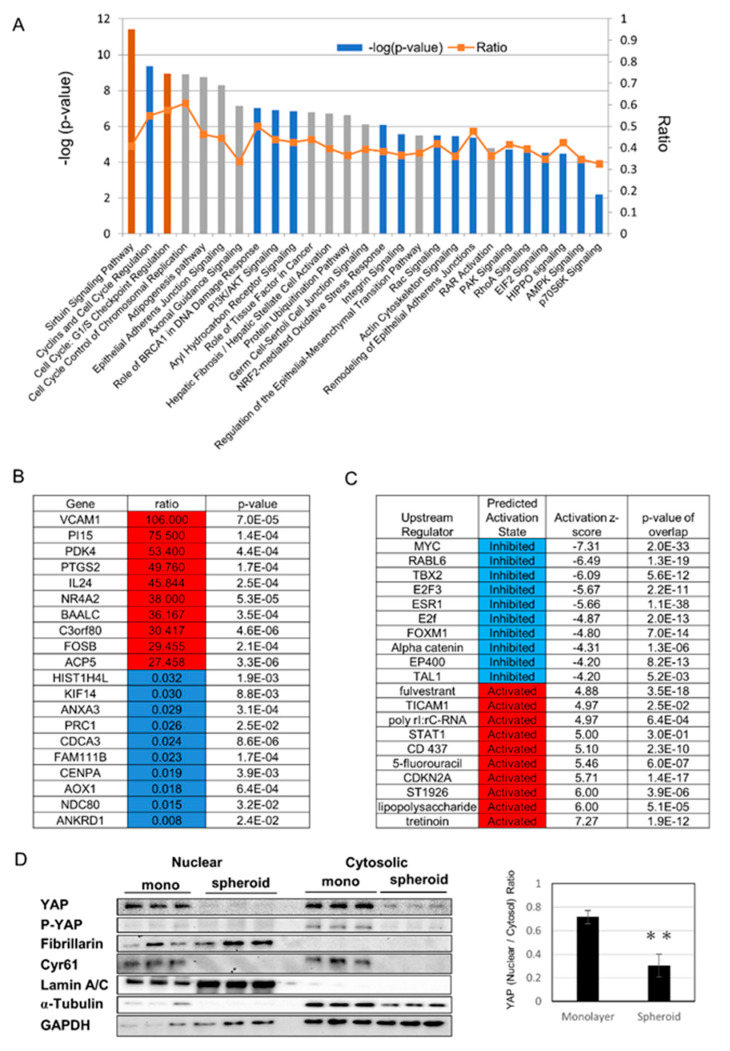
Figure 2.
Gene expression analysis using serial analysis of gene expression (SAGE): (A) selected significantly enriched canonical pathways identified by ingenuity pathway analysis (IPA). The diagram shows significantly overrepresented canonical pathways. A multiple-testing corrected p-value was calculated using the Benjamini–Hochberg method to control the rate of false discoveries in statistical hypothesis testing. The ratio value represents the number of molecules in a given pathway that meet the cut-off criteria, divided by the total number of molecules that belong to the function. The brown bar indicates positive z-score, blue bar indicates negative z-score, and grey bar indicates no activity pattern available. (B) Top 10 and bottom 10 list of genes with major changes in expression, with increased expression shown in red and decreased expression shown in blue. (C) Among upstream regulators identified by IPA, the top five and bottom five expected activators are shown in red and expected inhibitors are shown in blue. (D) (Left) Protein expression by nuclear and cytosolic compartments. Cyr61 is a downstream gene of YAP. Lamin A/C is a nuclear marker and fibrillarin is a nucleolus marker. (Right) Ratio of nuclear YAP/Cytosolic YAP (yes-associated protein), ** p ≤ 0.01.

