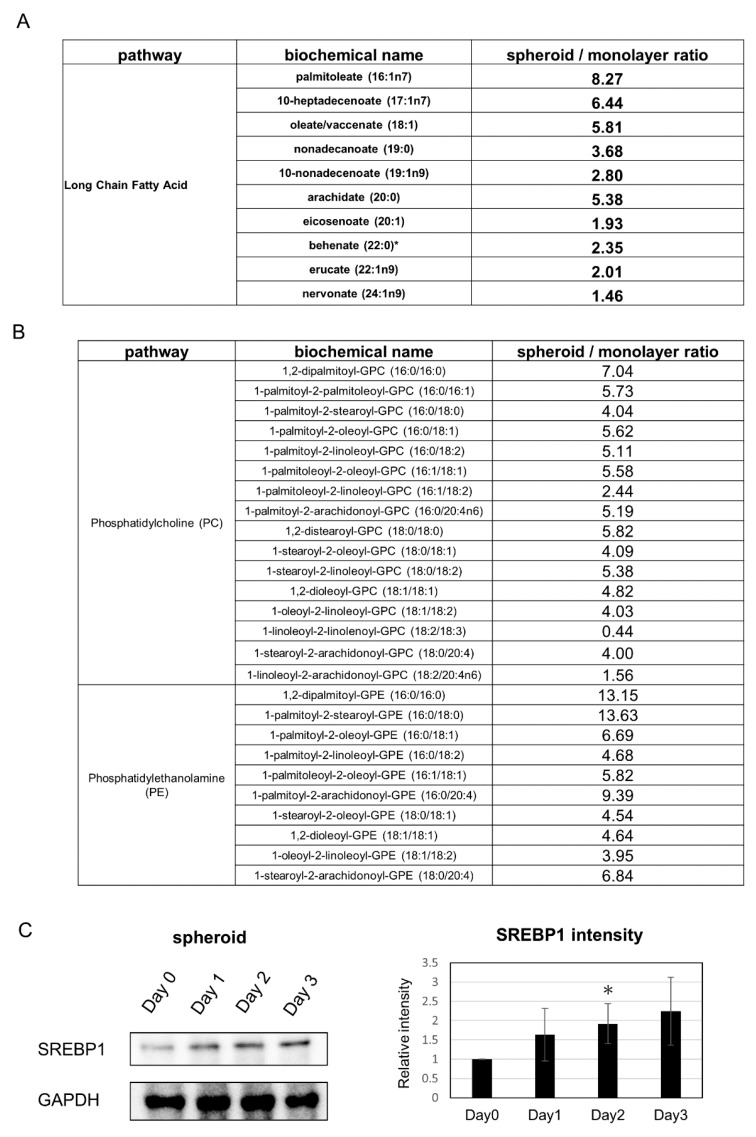
Figure 5.
Changes in metabolic products related to lipid metabolism: (A) Changes in saturated long-chain fatty acids. (B) Changes in phosphatidylcholine (PC) and phosphatidylethanolamine (PE). (C) (Left) Western blot analysis of SREBP1 expression. (Right) Quantification of SREBP1 expression. * p ≤ 0.05, compared to Day 0.

