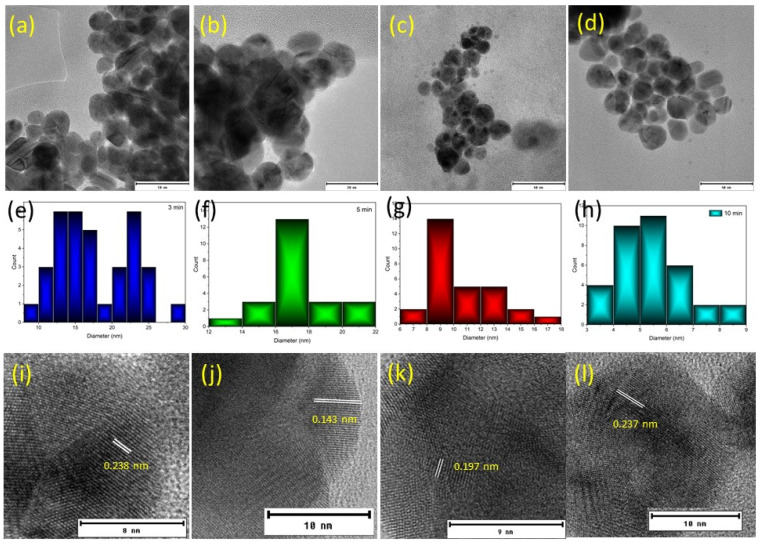
Figure 3.
Transmission Electron Microscopy (TEM) images of the nanoparticles synthesised under different plasma exposure times: (a) 3 min, (b) 5 min, (c) 7 min, (d) 10 min; size distribution of the nanoparticles determined from TEM: (e) 3 min, (f) 5 min, (g) 7 min, (h) 10 min; HRTEM of nanoparticles (i) 3 min, (j) 5 min, (k) 7 min, (l) 10 min.

