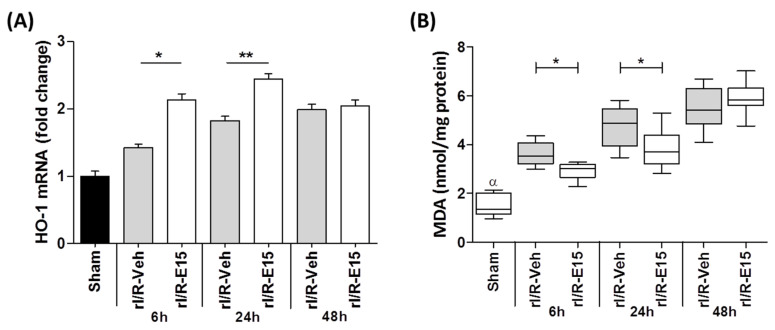
Figure 7.
The E15 effect on Ho-1 expression and lipid peroxidation level after rI/R in the timeline (6, 24, and 48 h). (A) Shows the fold changes of Ho-1 mRNA quantified by qRT-PCR (mean ± SD) and (B) shows a Box-and-whisker plot (median, first-third quartile, minimum- maximum value) with MDA levels formation by TBARS assay. * p < 0.05, ** p < 0.01 compared to rI/R-veh. α p < 0.01 compared to rI/R-veh and rI/R-E15 groups, at 48 h.

